. 2013 Mar 22;288(12):8136-8145.
doi: 10.1074/jbc.M112.389536. Epub 2013 Jan 28.

H2O2 regulates lung epithelial sodium channel (ENaC) via ubiquitin-like protein Nedd8

Affiliations

H2O2 regulates lung epithelial sodium channel (ENaC) via ubiquitin-like protein Nedd8

Charles A Downs et al. J Biol Chem. .

Abstract

Redundancies in both the ubiquitin and epithelial sodium transport pathways allude to their importance of proteolytic degradation and ion transport in maintaining normal cell function. The classical pathway implicated in ubiquitination of the epithelial sodium channel (ENaC) involves Nedd4-2 regulation of sodium channel subunit expression and has been studied extensively studied. However, less attention has been given to the role of the ubiquitin-like protein Nedd8. Here we show that Nedd8 plays an important role in the ubiquitination of ENaC in alveolar epithelial cells. We report that the Nedd8 pathway is redox-sensitive and that under oxidizing conditions Nedd8 conjugation to Cullin-1 is attenuated, resulting in greater surface expression of α-ENaC. This observation was confirmed in our electrophysiology studies in which we inhibited Nedd8-activating enzyme using MLN4924 (a specific Nedd8-activating enzyme inhibitor) and observed a marked increase in ENaC activity (measured as the product of the number of channels (N) and the open probability (Po) of a channel). These results suggest that ubiquitination of lung ENaC is redox-sensitive and may have significant implications for our understanding of the role of ENaC in pulmonary conditions where oxidative stress occurs, such as pulmonary edema and acute lung injury.


Figures
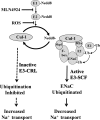
FIGURE 1.
FIGURE 1.
Model for redox regulation of ENaC where reactive ROS or MLN4924 inactivates the Ubc12 enzyme, hindering E3-CRL complex formation (i.e. ubiquitination of the target substrate). In this model, oxidizing conditions (or MLN4924 inhibition of neddylation) attenuates ubiquitination of α-ENaC (dashed arrows). Conversely, neddylation (Cul-1-Nedd8 conjugation) results in ubiquitination of α-ENaC (solid arrow). Skp1, Cul-1, and F-box comprise the E3 ligase (E3-SCF) alongside Rbx, a small zinc-binding domain. This is called the RING finger, to which the E2-ubiquitin conjugate binds. Cul-1, Cullin-1; Ub, ubiquitin.
FIGURE 2.
FIGURE 2.
Lung ENaC is redox-sensitive. A, continual, representative, single channel patch clamp recording obtained from isolated primary alveolar T2 cell before and after 250 μm H202 application (as indicated on the trace). B and C, higher resolution of the single channel recording shown in A, 30 s in duration, showing increases in open probability (Po), the fraction of time a channel is open, following H202 treatment. In A–C, the arrow denotes the closed state, and downward deflections from the closed state represent inward Na current. D, average Po values from four independent observations show that ENaC activity significantly increases following H202 treatment. Data were sampled from 5-min recording periods before, 5–10 min after, and beyond 30 min of hydrogen peroxide application. *, p < 0.05. E and F, chord conductances (γ) were calculated following H202 treatment, showing HSC (Ave γ = 6 ± 1.1 pS) and NSC (Ave γ = 11 ± 0.85 pS) channel activity under oxidizing conditions.
FIGURE 3.
FIGURE 3.
H2O2 increases cell surface expression of α-ENaC in alveolar epithelial cells. A, characterization of anti-α-ENaC C20 antibody under non-reducing (-DTT) and reducing (+DTT) conditions with a peptide competition assay (right panel) indicating antibody specificity and β-actin loading controls. B, representative blot and quantification of the 65-kDa α-ENaC immunoreactive band assayed from whole cell lysate following 0.5 mm H2O2 treatment. A larger, ∼150-kDa band was also detected following hydrogen peroxide treatment and noted with an asterisk. C, representative blot and quantification of surface α-ENaC assayed from biotinylated T2 cells following treatment with 0.5 mm H202. D, 0.5 mm H2O2 did not affect relative ENaC subunit mRNA expression levels. n = 3. *, p < 0.05.
FIGURE 4.
FIGURE 4.
MLN4924 decreases Nedd8 conjugation to Cullin-1 and increases the expression of α-ENaC in isolated rat alveolar T2 cells. A, Western blot analysis (IB) demonstrating that in the presence of DTT the Cullin-1- Nedd8 conjugate is ∼95 kDa. IP, immunoprecipitation. B, Western blot analysis depicting changes in Cullin1-Nedd8 conjugates in response to 10 nm and 100 nm MLN4924 with quantification of blots shown in a bar graph. C, Western blot analysis demonstrating an increase in total α-ENaC following treatment with 10 nm or 100 nm MLN4924. The graphs below show quantification of α-ENaC. D, Western blot analysis and bar graph demonstrating biotinylated α-ENaC expression following treatment with 100 nm MLN4924. E, a cycloheximide chase experiment shows preservation of α-ENaC expression in isolated rat T2 cells. n = 3. *, p < 0.05.
FIGURE 5.
FIGURE 5.
MLN4924 increases ENaC activity in lung primary T1 cells. A, representative single channel patch recording of a primary T1 cell in the cell-attached configuration. The arrow denotes the closed state, and downward deflections represent Na channel openings. Enlarged insets of the recording from the control (i) period and near 5 (ii), 15 (iii), 30 (iv) and 50 (v) min (-40 mV, -Vp) are shown. B and C, calculated chord conductance of HSC and NSC channels present in T1 cells. D, results from five independent observations shown on dot-plot graphs with y axis = ENaC activity (NPo) measured as the product of the number of channels (N) and the open probability (Po). NPo values increased from 0.34 ± 0.20 to 0.82 ± 0.30. p = 0.05.
FIGURE 6.
FIGURE 6.
MLN4924 increases ENaC activity in isolated rat alveolar T2 cells. A, representative single channel patch recording of alveolar T2 cell in the cell-attached configuration. The arrow denotes the closed state, and downward deflections represent Na+ channel openings and breaks in the recording (indicated with //). Again, enlarged excerpts of the control (i) period recording and at ∼7.5 (ii), 27.5 (iii), 47.5 (iv) and 62.5 (v) min (-40 mV (-Vp)) are shown. B and C, IV curves depicting the calculated chord conductance of HSC channels (7pS) and NSC (12pS) channels present in T2 cells. D, results from eight independent observations shown on dot-plot graphs with y axis = ENaC activity (NPo), where n = number of channels and Po = open probability. NPo values increased from 0.07 ± 0.03 to 0.80 ± 0.16. p < 0.005.
FIGURE 7.
FIGURE 7.
MLN4924 increases lung clearance in vivo. Line graph showing changes in lung fluid clearance presented with time on the x axis and I-Io on the y axis, where I is the x-ray density at a respective time and Io is the initial x-ray density following the tracheal instillation. Mice received a tracheal instillation of either 10 μm MLN4924 (●), saline only (■), 10 μm MLN4924 with 1 mm amiloride (○), or 1 mm amiloride alone (□). *, p < 0.01; #, p < 0.05.
FIGURE 8.
FIGURE 8.
Nedd8-mediated ubiquitination of α-ENaC is redox-sensitive. A, coimmunoprecipitation (IP) of Cullin-1 and Nedd8 with α-ENaC shown under denaturing (+DTT) conditions. The intense bands below 60 kDa are immunoglobulins. IB, immunoblot. B, coimmunoprecipitation of α-ENaC and Ubc12 from isolated T2 cell treated ± 0.5 mm H2O2. The left panel shows the predicted molecular weight for Ubc12. The right panel shows that H2O2 reduced Ubc 12 conjugated α-ENaC. n = 3. p < 0.05. C, T2 cell lysate was treated ± 0.5 mm H2O2 for 1 h, and the ubiquitinated protein was quantified using P4D1 ubiquitin antibody. Data were normalized to the β-actin expression level. n = 3. p = 0.01. D, α-ENaC was detected in T2 cell lysate (left panel). Ubiquitinated α-ENaC was detected (right panel) following immunoprecipitation of α-ENaC (using anti-α -ENaC C20 antibody and P4D1 ubiquitin antibody) in samples ± 2 h exposure to 0.5 mm H2O2. Quantification of immunoprecipitated α-ENaC (± 0.5 mm H2O2 exposure for 2 h) demonstrates an ∼40% reduction in ubiquitination. n = 4. p = 0.02.

Similar articles

Cited by

References

    1. Firsov D., Gautschi I., Merillat A. M., Rossier B. C., Schild L. (1998) The heterotetrameric architecture of the epithelial sodium channel (ENaC). EMBO J. 17, 344–352 - PMC - PubMed
    1. Kelly O., Lin C., Ramkumar M., Saxena N. C., Kleyman T. R., Eaton D. C. (2003) Characterization of an amiloride binding region in the α-subunit of ENaC. Am. J. Physiol. Renal Physiol. 285, F1279–F1290 - PubMed
    1. Hummler E., Rossier B. C. (1996) Physiological and pathophysiological role of the epithelial sodium channel in the control of blood pressure. Kidney Blood Press. Res. 19, 160–165 - PubMed
    1. Staub O., Gautschi I., Ishikawa T., Breitschopf K., Ciechanover A., Schild L., Rotin D. (1997) Regulation of stability and function of the epithelial Na+ channel (ENaC) by ubiquitination. EMBO J. 16, 6325–6336 - PMC - PubMed
    1. Yu L., Helms M. N., Yue Q., Eaton D. C. (2008) Single-channel analysis of functional epithelial sodium channel (ENaC) stability at the apical membrane of A6 distal kidney cells. Am. J. Physiol. Renal Physiol. 295, F1519–F1527 - PMC - PubMed

MeSH terms

LinkOut - more resources