Branching and capping determine the force-velocity relationships of branching actin networks
- PMID: 23358606
- PMCID: PMC3584351
- DOI: 10.1088/1478-3975/10/1/016004
Branching and capping determine the force-velocity relationships of branching actin networks
Abstract
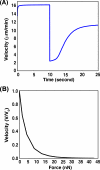
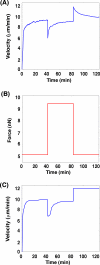
A branching actin network is the major engine that drives cell motility. A measure of the effectiveness of an engine is the velocity the engine is able to produce at a given resistance-the force-velocity relationship. Concave force-velocity relationships consist of a force-insensitive region, indicative of an adaptive response. In contrast, convex force-velocity relationships would reflect a passive response. Even in in vitro experiments, branching actin networks can exhibit both concave and convex force-velocity curves. However, the exact mechanism that can explain both force-velocity curves is not yet known. We carried out an agent-based stochastic simulation to explore such a mechanism. We discovered an emergent behavior of a branching actin network: Upon resistance, it remodels itself by increasing the number of filaments growing in contact with the load. The remodeling is favored by branching events and limited by capping. The force-velocity relationship hinges on the relative time-scale between the intrinsic kinetics of the branching actin network and the loading. Shortly after encountering resistance (∼seconds), the force-velocity relationship of the actin network is always convex, as it does not have enough time to remodel itself. A concave force-velocity relationship requires network remodeling at longer time-scales (∼tens of seconds to minutes) and the faster branching event relative to capping. Furthermore, our model explains the observed hysteresis in the force-velocity relationship of actin networks. Our model thus establishes a unified mechanism that can account for both convex and concave force-velocity relationships observed in branching actin networks.
Figures


Similar articles
-
Two competing orientation patterns explain experimentally observed anomalies in growing actin networks.Proc Natl Acad Sci U S A. 2010 Apr 6;107(14):6304-9. doi: 10.1073/pnas.0913730107. Epub 2010 Mar 22. Proc Natl Acad Sci U S A. 2010. PMID: 20308581 Free PMC article.
-
How does the antagonism between capping and anti-capping proteins affect actin network dynamics?J Phys Condens Matter. 2011 Sep 21;23(37):374101. doi: 10.1088/0953-8984/23/37/374101. Epub 2011 Aug 23. J Phys Condens Matter. 2011. PMID: 21862844
-
Branching influences force-velocity curves and length fluctuations in actin networks.Phys Rev E Stat Nonlin Soft Matter Phys. 2014 Dec;90(6):062718. doi: 10.1103/PhysRevE.90.062718. Epub 2014 Dec 29. Phys Rev E Stat Nonlin Soft Matter Phys. 2014. PMID: 25615140
-
How do in vitro reconstituted actin-based motility assays provide insight into in vivo behavior?FEBS Lett. 2008 Jun 18;582(14):2086-92. doi: 10.1016/j.febslet.2008.02.065. Epub 2008 Mar 5. FEBS Lett. 2008. PMID: 18328266 Review.
-
Actin-based motility as a self-organized system: mechanism and reconstitution in vitro.C R Biol. 2003 Feb;326(2):161-70. doi: 10.1016/s1631-0691(03)00067-2. C R Biol. 2003. PMID: 12754935 Review.
Cited by
-
Mathematical modeling of eukaryotic cell migration: insights beyond experiments.Annu Rev Cell Dev Biol. 2013;29:501-28. doi: 10.1146/annurev-cellbio-101512-122308. Epub 2013 Jul 24. Annu Rev Cell Dev Biol. 2013. PMID: 23909278 Free PMC article. Review.
-
A mechanism with severing near barbed ends and annealing explains structure and dynamics of dendritic actin networks.Elife. 2022 Jun 7;11:e69031. doi: 10.7554/eLife.69031. Elife. 2022. PMID: 35670664 Free PMC article.
-
Load sharing in the growth of bundled biopolymers.New J Phys. 2014 Nov 1;16(11):113047. doi: 10.1088/1367-2630/16/11/113047. New J Phys. 2014. PMID: 25489273 Free PMC article.
-
Building a dendritic actin filament network branch by branch: models of filament orientation pattern and force generation in lamellipodia.Biophys Rev. 2018 Dec;10(6):1577-1585. doi: 10.1007/s12551-018-0475-7. Epub 2018 Nov 12. Biophys Rev. 2018. PMID: 30421277 Free PMC article. Review.
References
-
- Amann KJ, Pollard TD. The Arp2/3 complex nucleates actin filament branches from the sides of pre-existing filaments. Nat Cell Biol. 2001;3:306–10. - PubMed
Publication types
MeSH terms
Substances
Grants and funding
LinkOut - more resources
Full Text Sources
Other Literature Sources
