. 2013 Apr;9(4):476-95.
doi: 10.4161/auto.23278. Epub 2013 Jan 24.

Ambra1 knockdown in zebrafish leads to incomplete development due to severe defects in organogenesis

Affiliations

Ambra1 knockdown in zebrafish leads to incomplete development due to severe defects in organogenesis

Francesca Benato et al. Autophagy. 2013 Apr.

Abstract

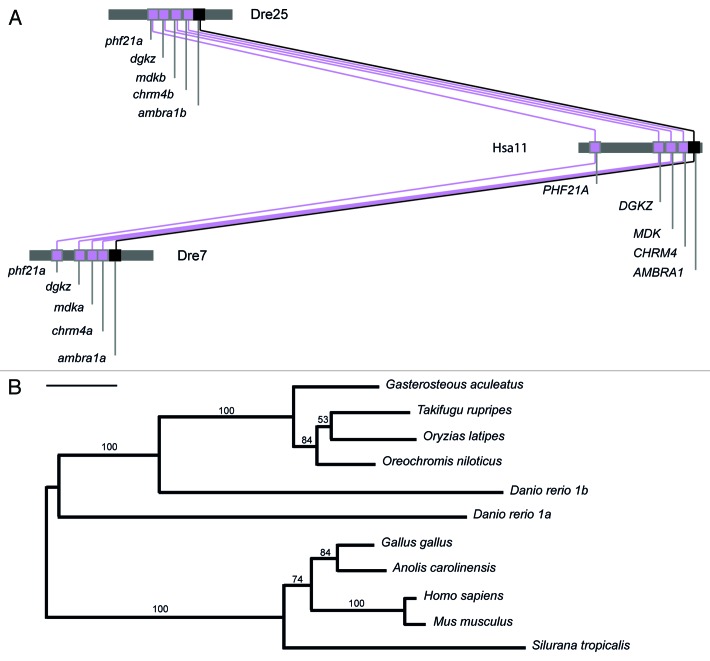
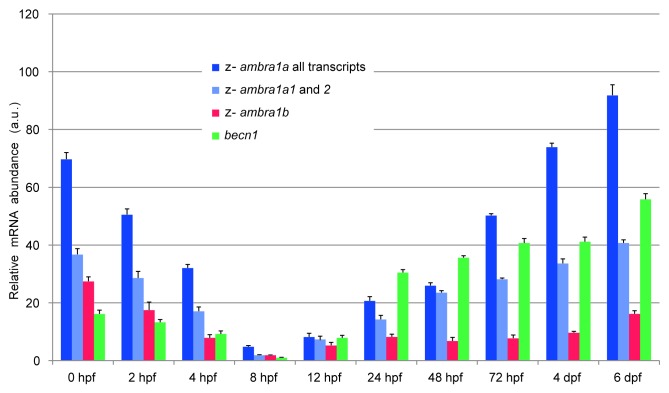
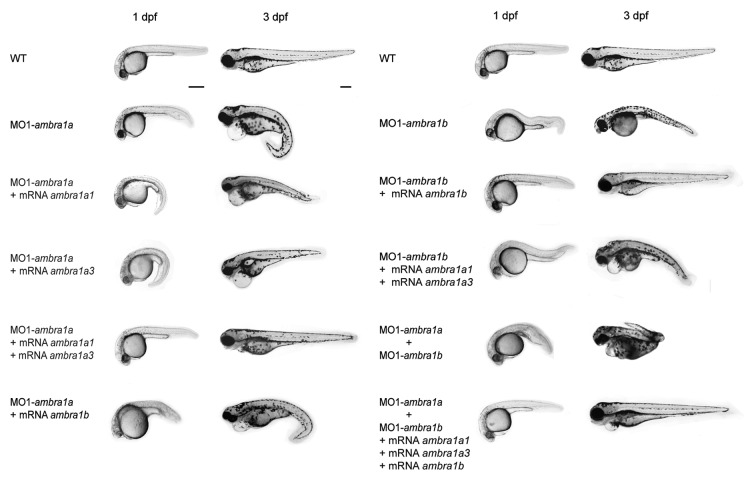
AMBRA1 is a positive regulator of the BECN1-dependent program of autophagy recently identified in mouse. In this study, we cloned the full-length cDNAs of ambra1a and ambra1b zebrafish paralogous genes. As in mouse, both Ambra1 proteins contain the characteristic WD40 repeat region. The transcripts of both genes are present as maternal RNAs in the eggs and display a gradual decline until 8 hpf, being replaced by zygotic mRNAs from 12 hpf onwards. After 24 hpf, the transcripts are mainly localized in the head, suggesting a possible role in brain development. To check their developmental roles, we adopted morpholino knockdown to block either translation (ATGMOs) or splicing (SPLICMOs). Treatment with ATGMOs causes severe embryonic malformations, as prelarvae could survive for only 3 and 4 days in ambra1a and b morphants, respectively. Treatment with SPLICMOs led to developmental defects only at a late stage, indicating the importance of maternally supplied ambra1 transcripts. Analysis of the levels of Lc3-II, an autophagosome-specific marker, in the presence of lysosome inhibitors evidenced a reduction in the rate of autophagosome formation in both MOs-injected embryos at 48 hpf, more pronounced in the case of ambra1a gene. Although some defects, such as body growth delay, curved shape and hemorrhagic pericardial cavity were present in both morphants, the occurrence of specific phenotypes, such as major abnormalities of brain development in ambra1a morphants, suggests the possible acquisition of specific functions by the two paralogous genes that are both required during development and do not compensate each other following knockdown.

Keywords: Ambra1; autophagy; development; morpholino; zebrafish.


Figures

None
Figure 1. Genomic structure and organization of zebrafish and mouse ambra1 genes. Plain boxes indicate exons. The coding region is in color and numbered with Roman numerals. Boxes of exon 8 are dashed in transcripts where it may be absent. The positions of the WD40 domain, BECN1 and DYNLL1 binding regions are indicated. Introns, represented as lines, are not drawn to scale, but the corresponding lengths can be found in Table S1 together with the exon sizes. Exons in zebrafish ambra1a and b are similar in size to orthologous exons in mouse Ambra1.
None
Figure 2. Multiple sequence alignment of human (Hs, Homo sapiens, Q9C0C7), mouse (Mm, Mus musculus, NP_766257) and zebrafish (Dr, Danio rerio) Ambra1 proteins was originated with the program ClustalW. Zebrafish Ambra1 amino acid sequence is inferred from the coding sequences cloned in this study (Ambra1a1, HE602022; Ambra1a2, HE602023; Ambra1a3, FR846231; Ambra1a4, HE602024; Ambra1b, FR846230). In the alignment, identical residues in all sequences are indicated by ‘*’. Conservative and semi-conservative substitutions are indicated by ‘:’ and ‘.’, respectively. The WD40 repeats-region at the N-terminus is indicated in BOX 1, the region involved in the BECN1 interaction in BOX 2 and the binding site to the dynein light chain (DYNLL1) in BOX 3, with the TQT-domain in bold. Position of exon 8, inside BECN1 binding region, is underlined.
None
Figure 3. Conserved synteny neighboring the AMBRA1 locus and evolutionary relationship of the known ambra1 genes. (A) Graphical representation of conserved synteny neighboring the AMBRA1 locus between D. rerio chromosomes 7 (Dre7) and 25 (Dre25) and H. sapiens chromosome 11 (Hsa11). The analysis was performed with the Synteny Database program (http://teleost.cs.uoregon.edu/acos/synteny_db/) with a sliding window size of 25 genes. Synteny analysis shows that the portion of zebrafish chromosome 7 (Dre7) that contains ambra1a and the portion of zebrafish chromosome 25 (Dre25) that contains ambra1b possess other four genes that are orthologous to genes in the portion of human chromosome 11 (Hsa11) that contains AMBRA1. Gene names are from Ensembl (www.ensemblgenomes.org/) or NCBI (www.ncbi.nlm.nih.gov/gene/). Genes are drawn as squares. The figure depicts the relative locations of genes, but is not drawn to physical scale. The positions of ambra1a, ambra1b and AMBRA1 are marked in black. Oblique lines connect presumed paralogs within chromosome groups. (B) Evolutionary relationship of the known ambra1 genes. The phylogenetic tree was calculated using the Maximum likelihood method with the RaxML 7.2.6 program and by applying the evolutionary model JTT+G. Bar represents 0.1 substitutions per site. Comparisons were made to the amino acid sequences of D. rerio Ambra1a (CCE04070), D. rerio Ambra1b (CCA61107), Takifugu rubripes (ENSTRUG00000013113), Gasterosteus aculeatus (ENSGACG00000007844), Orizyas latipes (ENSORLP00000017709), Silurana tropicalis (XP_002934144), Anolis carolinensis (XP_003214662), Gallus gallus (ENSGALP00000013594), Oreochromis niloticus (XP_003458340), Mus musculus (NP_766257), Homo sapiens (Q9C0C7). Numbers indicate the values supporting the branching pattern from 1000 bootstraps.
None
Figure 4. Temporal expression patterns of the duplicated zebrafish ambra1 genes. The graph shows the relative mRNA transcript abundance of ambra1a (all transcript variants), ambra1a1 and 2 and ambra1b, as well as becn1 mRNAs in whole zebrafish embryos, from 0 to 6 dpf, as determined by qPCR. Error bars indicate SEM.
None
Figure 5. Spatio-temporal expression of ambra1a1 and ambra1b mRNA during zebrafish development as evidenced by whole-mount in situ hybridization performed at the indicated stages. All embryos are lateral views with the animal pole up (1 cell and 10 hpf) and head pointing to the left (1, 4 and 6 dpf). 10× magnification of the embryo (dorsal view) on the left. Scale bar: 200 μm. (A and B) Transverse histological sections 6 μm thick of the 6 dpf ambra1a1 (A) and ambra1b (B) labeled embryos (the dashed lines in 6 dpf whole-mount embryos indicate the position of the section). Ov = otic vesicle, Sb = swim bladder, In = intestinal cavity.
None
Figure 6. Phenotypes of embryos or larvae at 1 and 3 dpf after treatment with the different ambra1 ATGMOs alone or together with tp53 MO or with SPLICMOs. Morphants phenotypes are compared with control groups (WT or MISMMOs). Phenotypes of tp53 MO morphants are also reported. Animals are presented as lateral view, anterior to the left. Scale bar: 200 μm.
None
Figure 7. Two-dpf embryos treated with different ambra1 ATGMOs and compared with controls. (A) SEM (scanning electron microscope) images of dorsal view, anterior to the left. The white dashed lines indicate position of the section reported in (C). (B) Light microscope image showing hydrocephalus (dashed lines). Asterisks indicate midbrain-hindbrain boundary. Lateral view head to the left. (C) Toluidine blue staining of semithin transverse sections. (D) SEM images of lateral view tails showing the morphants deformities compared with controls. (E) Transversal semithin sections stained with toluidine blue displaying notochord malformations in different morphants. Scale bar: 100 μm.
None
Figure 8. Close-up lateral and ventral light microscopy views of 3 dpf wild-type and ATGMOs-injected embryos. The genes targeted by ATGMOs are indicated for each image. Otic vesicles are smaller in MO1-ambra1a and ATGMO-coinjected morphants (dashed lines). White arrowheads indicate cyclopia in ambra1b and coinjected morphants. All morphants presented pericardial edema (arrow). Scale bar: 200 μm
None
Figure 9. Lateral SEM and light microscopy views of wild-type and SPLICMOs-injected embryos. Top panel: Two-dpf embryos treated with ambra1a and b SPLICMOs and compared with controls. SEM images of dorsal view showing the morphant deformities compared with control. Botton panel: Close-up lateral and ventral light microscopy views of 5 and 10 dpf WT and SPLICMOs-injected embryos. The genes targeted by SPLICMOs are indicated for each image. Otic vesicles are smaller in MO2-ambra1a (dashed lines). Both SPLICMO morphants presented pericardial edema (arrow) and reduced eyes (asterisks). Scale bar: 200 μm
None
Figure 10. Phenotype comparison among ATGMOs treated embryos and uninjected controls (WT) after the different rescue experiments. The genes targeted by ATGMOs and the mRNAs injected are indicated for each image. All the embryos are lateral view, anterior to the left. Scale bar: 200 μm.
None
Figure 11. Analysis of autophagy and of BECN1 levels in ambra1-MOs injected embryos. (A and B) Analysis of autophagy in ambra1-MOs injected embryos. Protein extracts were prepared from WT and ambra1a (A) or ambra1b (B) MOs-injected embryos at 48 hpf and subjected to immunoblotting analysis using an anti-LC3 antibody. A parallel set of embryos were incubated with the lysosome inhibitor bafilomycin A1 for 6 h before lysis, in order to assess the rate of autophagic flux upon Ambra1 downregulation. A graph reporting data from three independent experiments is shown together a representative immunoblot image. Values represent the densitometric measurement of LC3-II band intensities normalized to the signals of the loading control actin. A.U.: arbitrary units. Please note that this LC3 antibody shows a stronger reactivity for the zebrafish type II form of LC3 than the type I, which is detected only at longer exposure times. However, to ensure that the detected LC3 isoform was LC3-II, protein extracts from HeLa cells were run as a reference marker. (C) Analysis of Becn1 levels in ambra1-MOs injected embryos. Protein extracts were prepared from WT and ambra1-MOs-injected embryos at 48 hpf and subjected to immunoblotting analysis using an anti-BECN1 antibody. Actin expression was monitored as a loading control.
None
Figure 12. TUNEL analysis to detect apoptotic nuclei in WT embryos and ambra1 ATGMOs (MO1-ambra1a and MO1-ambra1b), SPLICMOs (MO2-ambra1a and MO2-ambra1b) and MISMMOs (MO1-ambra1a-5m and MO1-ambra1b-5m) embryos at 24 hpf. Minimal evidence of apoptosis was found in WT while a highly increased number of TUNEL-positive cells was detectable in the head region of ATGMOs- and SPLICMOs-injected embryos. Scale bar: 200 μm. Insert: differences in the TUNEL-positive cell number between both ATGMOs- and SPLICMOs-injected embryos compared with the control embryos (WT and MISMMOs). Values represent the mean ± SD (n = 5). “*” indicates that the difference in the expression levels are significantly different (p < 0.05; **p < 0.01; ***p < 0.001).
None
Figure 13. WMISH showing expression of the developmental markers, gsc, chd and shha, in ambra1-MOs-injected and control embryos. Dorsal views with the head pointing to the top in 1 dpf embryos. Scale bar: 200 μm.

Similar articles

Cited by

  • Neurodevelopmental Disorders: Functional Role of Ambra1 in Autism and Schizophrenia.
    La Barbera L, Vedele F, Nobili A, D'Amelio M, Krashia P. La Barbera L, et al. Mol Neurobiol. 2019 Oct;56(10):6716-6724. doi: 10.1007/s12035-019-1557-7. Epub 2019 Mar 26. Mol Neurobiol. 2019. PMID: 30915711 Review.
  • Mitophagy and Alzheimer's Disease: Cellular and Molecular Mechanisms.
    Kerr JS, Adriaanse BA, Greig NH, Mattson MP, Cader MZ, Bohr VA, Fang EF. Kerr JS, et al. Trends Neurosci. 2017 Mar;40(3):151-166. doi: 10.1016/j.tins.2017.01.002. Epub 2017 Feb 9. Trends Neurosci. 2017. PMID: 28190529 Free PMC article. Review.
  • Ambra1 spatially regulates Src activity and Src/FAK-mediated cancer cell invasion via trafficking networks.
    Schoenherr C, Byron A, Sandilands E, Paliashvili K, Baillie GS, Garcia-Munoz A, Valacca C, Cecconi F, Serrels B, Frame MC. Schoenherr C, et al. Elife. 2017 Mar 31;6:e23172. doi: 10.7554/eLife.23172. Elife. 2017. PMID: 28362576 Free PMC article.
  • Autophagy in Drosophila and Zebrafish.
    Duan X, Tong C. Duan X, et al. Adv Exp Med Biol. 2021;1208:333-356. doi: 10.1007/978-981-16-2830-6_15. Adv Exp Med Biol. 2021. PMID: 34260032
  • Guidelines for the use and interpretation of assays for monitoring autophagy (4th edition)1.
    Klionsky DJ, Abdel-Aziz AK, Abdelfatah S, Abdellatif M, Abdoli A, Abel S, Abeliovich H, Abildgaard MH, Abudu YP, Acevedo-Arozena A, Adamopoulos IE, Adeli K, Adolph TE, Adornetto A, Aflaki E, Agam G, Agarwal A, Aggarwal BB, Agnello M, Agostinis P, Agrewala JN, Agrotis A, Aguilar PV, Ahmad ST, Ahmed ZM, Ahumada-Castro U, Aits S, Aizawa S, Akkoc Y, Akoumianaki T, Akpinar HA, Al-Abd AM, Al-Akra L, Al-Gharaibeh A, Alaoui-Jamali MA, Alberti S, Alcocer-Gómez E, Alessandri C, Ali M, Alim Al-Bari MA, Aliwaini S, Alizadeh J, Almacellas E, Almasan A, Alonso A, Alonso GD, Altan-Bonnet N, Altieri DC, Álvarez ÉMC, Alves S, Alves da Costa C, Alzaharna MM, Amadio M, Amantini C, Amaral C, Ambrosio S, Amer AO, Ammanathan V, An Z, Andersen SU, Andrabi SA, Andrade-Silva M, Andres AM, Angelini S, Ann D, Anozie UC, Ansari MY, Antas P, Antebi A, Antón Z, Anwar T, Apetoh L, Apostolova N, Araki T, Araki Y, Arasaki K, Araújo WL, Araya J, Arden C, Arévalo MA, Arguelles S, Arias E, Arikkath J, Arimoto H, Ariosa AR, Armstrong-James D, Arnauné-Pelloquin L, Aroca A, Arroyo DS, Arsov I, Artero R, Asaro DML, Aschner M, Ashrafizadeh M, Ashur-Fabian O, Atanasov AG, Au AK, Auberger P, Auner HW, Aurelian L, Autelli R… See abstract for full author list ➔ Klionsky DJ, et al. Autophagy. 2021 Jan;17(1):1-382. doi: 10.1080/15548627.2020.1797280. Epub 2021 Feb 8. Autophagy. 2021. PMID: 33634751 Free PMC article.

References

    1. Ravikumar B, Futter M, Jahreiss L, Korolchuk VI, Lichtenberg M, Luo S, et al. Mammalian macroautophagy at a glance. J Cell Sci. 2009;122:1707–11. doi: 10.1242/jcs.031773. - DOI - PMC - PubMed
    1. Sharp ZD. Aging and TOR: interwoven in the fabric of life. Cell Mol Life Sci. 2011;68:587–97. doi: 10.1007/s00018-010-0542-0. - DOI - PMC - PubMed
    1. García-Arencibia M, Hochfeld WE, Toh PP, Rubinsztein DC. Autophagy, a guardian against neurodegeneration. Semin Cell Dev Biol. 2010;21:691–8. doi: 10.1016/j.semcdb.2010.02.008. - DOI - PMC - PubMed
    1. Cecconi F, Levine B. The role of autophagy in mammalian development: cell makeover rather than cell death. Dev Cell. 2008;15:344–57. doi: 10.1016/j.devcel.2008.08.012. - DOI - PMC - PubMed
    1. Rubinsztein DC, Gestwicki JE, Murphy LO, Klionsky DJ. Potential therapeutic applications of autophagy. Nat Rev Drug Discov. 2007;6:304–12. doi: 10.1038/nrd2272. - DOI - PubMed

Publication types

MeSH terms

LinkOut - more resources