On-demand optogenetic control of spontaneous seizures in temporal lobe epilepsy
- PMID: 23340416
- PMCID: PMC3562457
- DOI: 10.1038/ncomms2376
On-demand optogenetic control of spontaneous seizures in temporal lobe epilepsy
Abstract
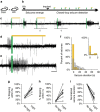
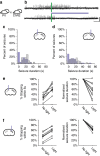
Temporal lobe epilepsy is the most common type of epilepsy in adults, is often medically refractory, and due to broad actions and long-time scales, current systemic treatments have major negative side-effects. However, temporal lobe seizures tend to arise from discrete regions before overt clinical behaviour, making temporally and spatially specific treatment theoretically possible. Here we report the arrest of spontaneous seizures using a real-time, closed-loop, response system and in vivo optogenetics in a mouse model of temporal lobe epilepsy. Either optogenetic inhibition of excitatory principal cells, or activation of a subpopulation of GABAergic cells representing <5% of hippocampal neurons, stops seizures rapidly upon light application. These results demonstrate that spontaneous temporal lobe seizures can be detected and terminated by modulating specific cell populations in a spatially restricted manner. A clinical approach built on these principles may overcome many of the side-effects of currently available treatment options.
Figures


Similar articles
-
Optogenetic intervention of seizures improves spatial memory in a mouse model of chronic temporal lobe epilepsy.Epilepsia. 2020 Mar;61(3):561-571. doi: 10.1111/epi.16445. Epub 2020 Feb 18. Epilepsia. 2020. PMID: 32072628 Free PMC article.
-
Medial septal GABAergic neurons reduce seizure duration upon optogenetic closed-loop stimulation.Brain. 2021 Jun 22;144(5):1576-1589. doi: 10.1093/brain/awab042. Brain. 2021. PMID: 33769452 Free PMC article.
-
Excitation, but not inhibition, of the fastigial nucleus provides powerful control over temporal lobe seizures.J Physiol. 2020 Jan;598(1):171-187. doi: 10.1113/JP278747. Epub 2019 Dec 9. J Physiol. 2020. PMID: 31682010 Free PMC article.
-
Optogenetic tools for modulating and probing the epileptic network.Epilepsy Res. 2015 Oct;116:15-26. doi: 10.1016/j.eplepsyres.2015.06.010. Epub 2015 Jun 21. Epilepsy Res. 2015. PMID: 26354163 Free PMC article. Review.
-
Hippocampal neurogenesis and neural stem cells in temporal lobe epilepsy.Epilepsy Behav. 2009 Jan;14 Suppl 1(Suppl 1):65-73. doi: 10.1016/j.yebeh.2008.08.020. Epub 2008 Oct 1. Epilepsy Behav. 2009. PMID: 18796338 Free PMC article. Review.
Cited by
-
GABAA signaling, focal epileptiform synchronization and epileptogenesis.Front Neural Circuits. 2022 Oct 5;16:984802. doi: 10.3389/fncir.2022.984802. eCollection 2022. Front Neural Circuits. 2022. PMID: 36275847 Free PMC article.
-
Optogenetic delay of status epilepticus onset in an in vivo rodent epilepsy model.PLoS One. 2013 Apr 24;8(4):e62013. doi: 10.1371/journal.pone.0062013. Print 2013. PLoS One. 2013. PMID: 23637949 Free PMC article.
-
Diminishing neuronal acidification by channelrhodopsins with low proton conduction.bioRxiv [Preprint]. 2023 Sep 14:2023.02.07.527404. doi: 10.1101/2023.02.07.527404. bioRxiv. 2023. Update in: Elife. 2023 Oct 06;12:RP86833. doi: 10.7554/eLife.86833 PMID: 36798192 Free PMC article. Updated. Preprint.
-
Human cortical interneurons optimized for grafting specifically integrate, abort seizures, and display prolonged efficacy without over-inhibition.Neuron. 2023 Mar 15;111(6):807-823.e7. doi: 10.1016/j.neuron.2022.12.014. Epub 2023 Jan 9. Neuron. 2023. PMID: 36626901 Free PMC article.
-
Theoretical Principles of Multiscale Spatiotemporal Control of Neuronal Networks: A Complex Systems Perspective.Front Comput Neurosci. 2018 Oct 8;12:81. doi: 10.3389/fncom.2018.00081. eCollection 2018. Front Comput Neurosci. 2018. PMID: 30349469 Free PMC article.
References
-
- Chang B. S. & Lowenstein D. H.. Epilepsy. N Engl. J. Med. 349, 1257–1266 (2003). - PubMed
-
- Gloor P., Olivier A., Quesney L. F., Andermann F. & Horowitz S.. The role of the limbic system in experiential phenomena of temporal lobe epilepsy. Ann. Neurol. 12, 129–144 (1982). - PubMed
-
- Morrell M. J.. Responsive cortical stimulation for the treatment of medically intractable partial epilepsy. Neurology 77, 1295–1304 (2011). - PubMed
-
- Boyden E. S., Zhang F., Bamberg E., Nagel G. & Deisseroth K.. Millisecond-timescale, genetically targeted optical control of neural activity. Nat. Neurosci. 8, 1263–1268 (2005). - PubMed
Publication types
MeSH terms
Substances
Grants and funding
LinkOut - more resources
Full Text Sources
Other Literature Sources
Medical
Molecular Biology Databases

