Innate and adaptive immune response to pneumonia virus of mice in a resistant and a susceptible mouse strain
- PMID: 23337382
- PMCID: PMC3564122
- DOI: 10.3390/v5010295
Innate and adaptive immune response to pneumonia virus of mice in a resistant and a susceptible mouse strain
Abstract
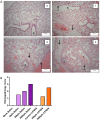
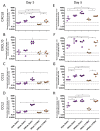
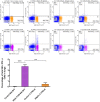
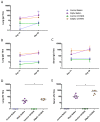
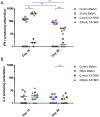
Respiratory syncytial virus (RSV) is the leading cause of infant bronchiolitis. The closely related pneumonia virus of mice (PVM) causes a similar immune-mediated disease in mice, which allows an analysis of host factors that lead to severe illness. This project was designed to compare the immune responses to lethal and sublethal doses of PVM strain 15 in Balb/c and C57Bl/6 mice. Balb/c mice responded to PVM infection with an earlier and stronger innate response that failed to control viral replication. Production of inflammatory cyto- and chemokines, as well as infiltration of neutrophils and IFN-γ secreting natural killer cells into the lungs, was more predominant in Balb/c mice. In contrast, C57Bl/6 mice were capable of suppressing both viral replication and innate inflammatory responses. After a sublethal infection, PVM-induced IFN-γ production by splenocytes was stronger early during infection and weaker at late time points in C57Bl/6 mice when compared to Balb/c mice. Furthermore, although the IgG levels were similar and the mucosal IgA titres lower, the virus neutralizing antibody titres were higher in C57Bl/6 mice than in Balb/c mice. Overall, the difference in susceptibility of these two strains appeared to be related not to an inherent T helper bias, but to the capacity of the C57Bl/6 mice to control both viral replication and the immune response elicited by PVM.
Figures



Similar articles
-
The response of aged mice to primary infection and re-infection with pneumonia virus of mice depends on their genetic background.Immunobiology. 2016 Mar;221(3):494-502. doi: 10.1016/j.imbio.2015.10.008. Epub 2015 Nov 18. Immunobiology. 2016. PMID: 26621546
-
Blunted inflammatory and mucosal IgA responses to pneumonia virus of mice in C57BL/6 neonates are correlated to reduced protective immunity upon re-infection as elderly mice.Virology. 2015 Nov;485:233-43. doi: 10.1016/j.virol.2015.07.019. Epub 2015 Aug 25. Virology. 2015. PMID: 26298860
-
Persistent Airway Hyperresponsiveness Following Recovery from Infection with Pneumonia Virus of Mice.Viruses. 2021 Apr 22;13(5):728. doi: 10.3390/v13050728. Viruses. 2021. PMID: 33922096 Free PMC article.
-
The Pneumonia Virus of Mice (PVM) model of acute respiratory infection.Viruses. 2012 Dec;4(12):3494-510. doi: 10.3390/v4123494. Viruses. 2012. PMID: 23342367 Free PMC article. Review.
-
Pneumonia virus of mice: severe respiratory infection in a natural host.Immunol Lett. 2008 Jun 15;118(1):6-12. doi: 10.1016/j.imlet.2008.03.013. Epub 2008 Apr 22. Immunol Lett. 2008. PMID: 18471897 Free PMC article. Review.
Cited by
-
Intranasal treatment with a novel immunomodulator mediates innate immune protection against lethal pneumonia virus of mice.Antiviral Res. 2016 Nov;135:108-119. doi: 10.1016/j.antiviral.2016.10.008. Epub 2016 Oct 19. Antiviral Res. 2016. PMID: 27771388 Free PMC article.
-
Production and differentiation of myeloid cells driven by proinflammatory cytokines in response to acute pneumovirus infection in mice.J Immunol. 2014 Oct 15;193(8):4072-82. doi: 10.4049/jimmunol.1400669. Epub 2014 Sep 8. J Immunol. 2014. PMID: 25200951 Free PMC article.
-
IL-20 Cytokines Are Involved in Epithelial Lesions Associated with Virus-Induced COPD Exacerbation in Mice.Biomedicines. 2021 Dec 5;9(12):1838. doi: 10.3390/biomedicines9121838. Biomedicines. 2021. PMID: 34944654 Free PMC article.
-
Characterization of pathogenesis of and immune response to Burkholderia pseudomallei K96243 using both inhalational and intraperitoneal infection models in BALB/c and C57BL/6 mice.PLoS One. 2017 Feb 24;12(2):e0172627. doi: 10.1371/journal.pone.0172627. eCollection 2017. PLoS One. 2017. PMID: 28235018 Free PMC article.
-
C57Bl/6N mice have an attenuated lung inflammatory response to dsRNA compared to C57Bl/6J and BALB/c mice.J Inflamm (Lond). 2023 Feb 21;20(1):6. doi: 10.1186/s12950-023-00331-4. J Inflamm (Lond). 2023. PMID: 36810092 Free PMC article.
References
-
- Bonville C.A., Bennett N.J., Koehnlein M., Haines D.M., Ellis J.A., DelVecchio A.M, Rosenberg H.F., Domachowske J.B. Respiratory dysfunction and proinflammatory chemokines in the pneumonia virus of mice (PVM) model of viral bronchiolitis. Virology. 2006;349:87–95. doi: 10.1016/j.virol.2006.02.017. - DOI - PubMed
-
- Iwane M.K., Edwards K.M., Szilagyi P.G., Walker F.J., Griffin M.R., Weinberg G.A., Coulen C., Poehling K.A., Shone L.P., Balter S., et al. Population-based surveillance for hospitalizations associated with respiratory syncytial virus, influenza virus, and parainfluenza viruses among young children. Pediatrics. 2004;113:1758–1764. doi: 10.1542/peds.113.6.1758. - DOI - PubMed
Publication types
MeSH terms
Substances
Grants and funding
LinkOut - more resources
Full Text Sources
Other Literature Sources
Miscellaneous

