

Geographic coincidence of increased malaria transmission hazard and vulnerability occurring at the periphery of two Tanzanian villages
- PMID: 23331947
- PMCID: PMC3557203
- DOI: 10.1186/1475-2875-12-24
Geographic coincidence of increased malaria transmission hazard and vulnerability occurring at the periphery of two Tanzanian villages
Abstract
Background: The goal of malaria elimination necessitates an improved understanding of any fine-scale geographic variations in transmission risk so that complementary vector control tools can be integrated into current vector control programmes as supplementary measures that are spatially targeted to maximize impact upon residual transmission. This study examines the distribution of host-seeking malaria vectors at households within two villages in rural Tanzania.
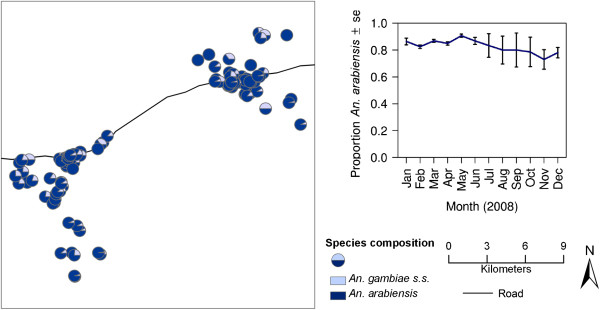
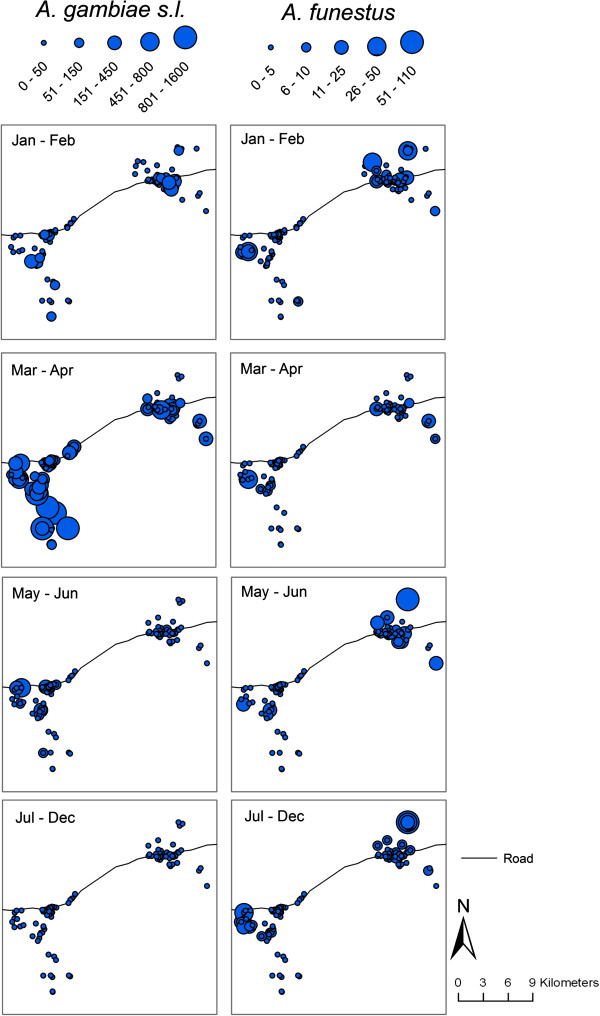
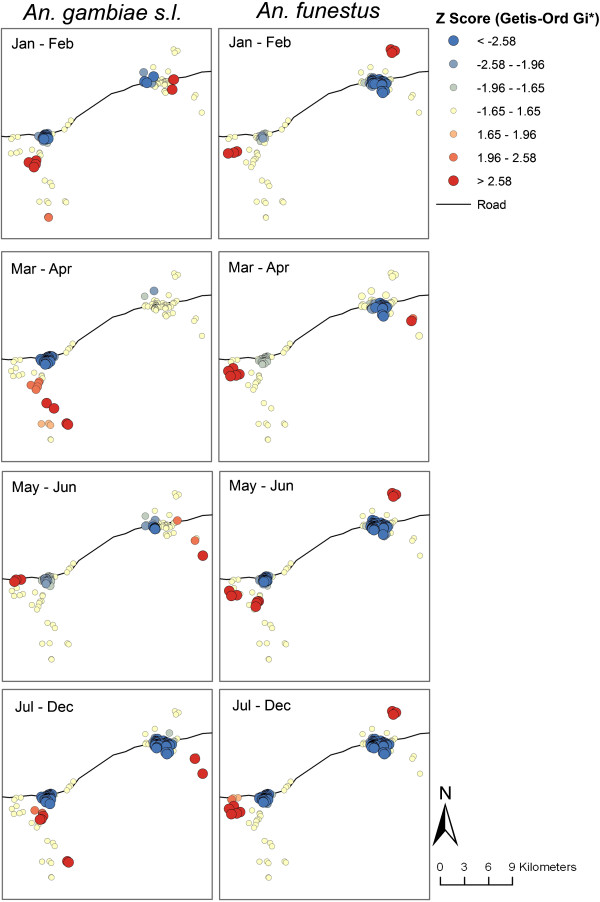
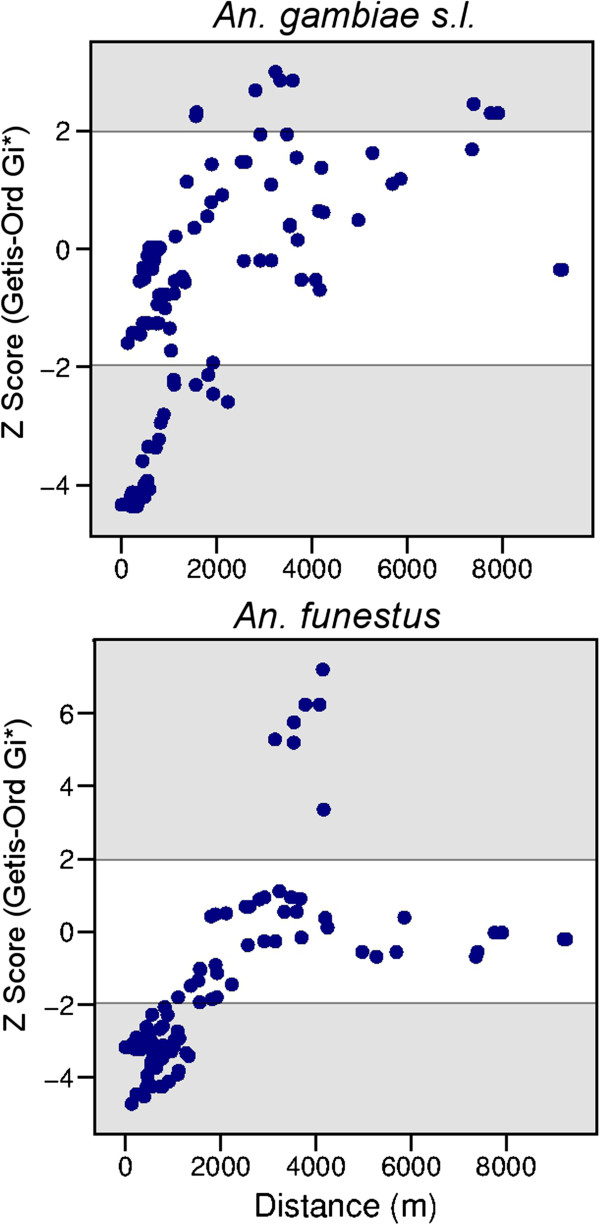
Methods: Host-seeking mosquitoes were sampled from 72 randomly selected households in two villages on a monthly basis throughout 2008 using CDC light-traps placed beside occupied nets. Spatial autocorrelation in the dataset was examined using the Moran's I statistic and the location of any clusters was identified using the Getis-Ord Gi* statistic. Statistical associations between the household characteristics and clusters of mosquitoes were assessed using a generalized linear model for each species.
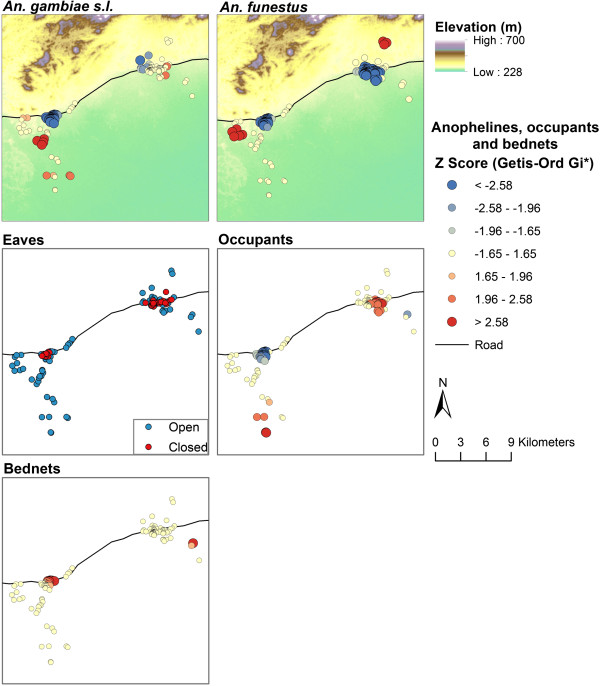
Results: For both Anopheles gambiae sensu lato and Anopheles funestus, the density of host-seeking females was spatially autocorrelated, or clustered. For both species, houses with low densities were clustered in the semi-urban village centre while houses with high densities were clustered in the periphery of the villages. Clusters of houses with low or high densities of An. gambiae s.l. were influenced by the number of residents in nearby houses. The occurrence of high-density clusters of An. gambiae s.l. was associated with lower elevations while An. funestus was also associated with higher elevations. Distance from the village centre was also positively correlated with the number of household occupants and having houses constructed with open eaves.
Conclusion: The results of the current study highlight that complementary vector control tools could be most effectively targeted to the periphery of villages where the households potentially have a higher hazard (mosquito densities) and vulnerability (open eaves and larger households) to malaria infection.
Figures

Similar articles
-
Correlations between household occupancy and malaria vector biting risk in rural Tanzanian villages: implications for high-resolution spatial targeting of control interventions.Malar J. 2016 Apr 12;15:199. doi: 10.1186/s12936-016-1268-8. Malar J. 2016. PMID: 27067147 Free PMC article.
-
Housing gaps, mosquitoes and public viewpoints: a mixed methods assessment of relationships between house characteristics, malaria vector biting risk and community perspectives in rural Tanzania.Malar J. 2018 Aug 17;17(1):298. doi: 10.1186/s12936-018-2450-y. Malar J. 2018. PMID: 30119666 Free PMC article.
-
A need for better housing to further reduce indoor malaria transmission in areas with high bed net coverage.Parasit Vectors. 2013 Mar 7;6:57. doi: 10.1186/1756-3305-6-57. Parasit Vectors. 2013. PMID: 23497471 Free PMC article.
-
Fine-scale distribution of malaria mosquitoes biting or resting outside human dwellings in three low-altitude Tanzanian villages.PLoS One. 2021 Jan 28;16(1):e0245750. doi: 10.1371/journal.pone.0245750. eCollection 2021. PLoS One. 2021. PMID: 33507908 Free PMC article.
-
Increasing role of Anopheles funestus and Anopheles arabiensis in malaria transmission in the Kilombero Valley, Tanzania.Malar J. 2014 Aug 24;13:331. doi: 10.1186/1475-2875-13-331. Malar J. 2014. PMID: 25150840 Free PMC article.
Cited by
-
Increasing outdoor host-seeking in Anopheles gambiae over 6 years of vector control on Bioko Island.Malar J. 2016 Apr 26;15:239. doi: 10.1186/s12936-016-1286-6. Malar J. 2016. PMID: 27113244 Free PMC article.
-
Integrating Parasitological and Entomological Observations to Understand Malaria Transmission in Riverine Villages in the Peruvian Amazon.J Infect Dis. 2021 Apr 27;223(12 Suppl 2):S99-S110. doi: 10.1093/infdis/jiaa496. J Infect Dis. 2021. PMID: 33906225 Free PMC article.
-
Landscape movements of Anopheles gambiae malaria vector mosquitoes in rural Gambia.PLoS One. 2013 Jul 18;8(7):e68679. doi: 10.1371/journal.pone.0068679. Print 2013. PLoS One. 2013. PMID: 23874719 Free PMC article.
-
Temporal and micro-spatial heterogeneity in the distribution of Anopheles vectors of malaria along the Kenyan coast.Parasit Vectors. 2013 Oct 28;6:311. doi: 10.1186/1756-3305-6-311. Parasit Vectors. 2013. PMID: 24330615 Free PMC article.
-
Correlations between household occupancy and malaria vector biting risk in rural Tanzanian villages: implications for high-resolution spatial targeting of control interventions.Malar J. 2016 Apr 12;15:199. doi: 10.1186/s12936-016-1268-8. Malar J. 2016. PMID: 27067147 Free PMC article.
References
-
- WHO. Global malaria control and elimination: report of a technical review. Geneva: World Health Organization; 2008.
-
- WHO. World malaria report 2011. Geneva: World Health Organization; 2011.
-
- Bhattarai A, Ali AS, Kachur SP, Mårtensson A, Abbas AK, Khatib R, Al-mafazy A-w, Ramsan M, Rotllant G, Gerstenmaier JF, Molteni F, Abdulla S, Montgomery SM, Kaneko A, Björkman A. Impact of artemisinin-based combination therapy and insecticide-treated nets on malaria burden in Zanzibar. PLoS Med. 2007;4:e309. doi: 10.1371/journal.pmed.0040309. - DOI - PMC - PubMed
-
- Ceesay SJ, Casals-Pascual C, Nwakanma DC, Walther M, Gomez-Escobar N, Fulford AJC, Takem EN, Nogaro S, Bojang KA, Corrah T, Jaye MC, Taal MA, Sonko AAJ, Conway DJ. Continued decline of malaria in The Gambia with implications for elimination. PLoS One. 2010;5:e12242. doi: 10.1371/journal.pone.0012242. - DOI - PMC - PubMed
Publication types
MeSH terms
LinkOut - more resources
Full Text Sources
Other Literature Sources
Medical
