. 2013 Apr;87(7):3699-709.
doi: 10.1128/JVI.02211-12. Epub 2013 Jan 16.

Timeless-dependent DNA replication-coupled recombination promotes Kaposi's Sarcoma-associated herpesvirus episome maintenance and terminal repeat stability

Affiliations

Timeless-dependent DNA replication-coupled recombination promotes Kaposi's Sarcoma-associated herpesvirus episome maintenance and terminal repeat stability

Jayaraju Dheekollu et al. J Virol. 2013 Apr.

Abstract

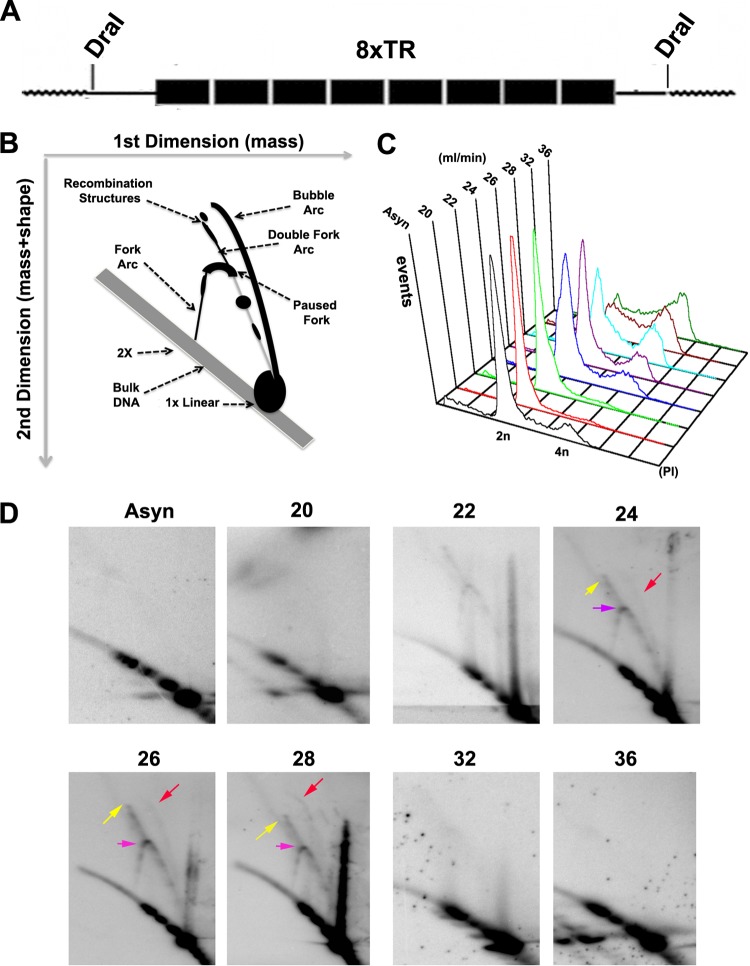
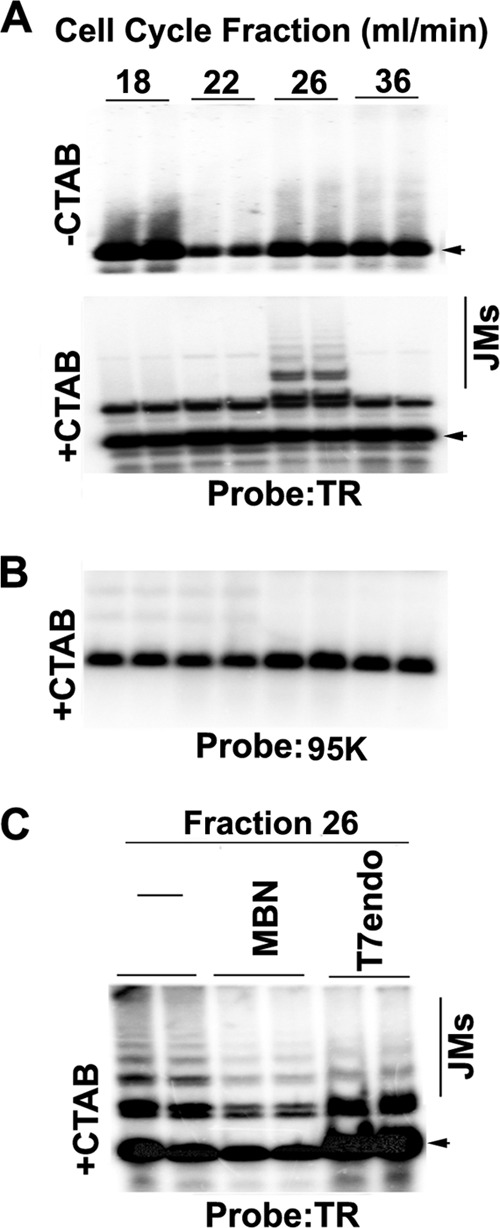
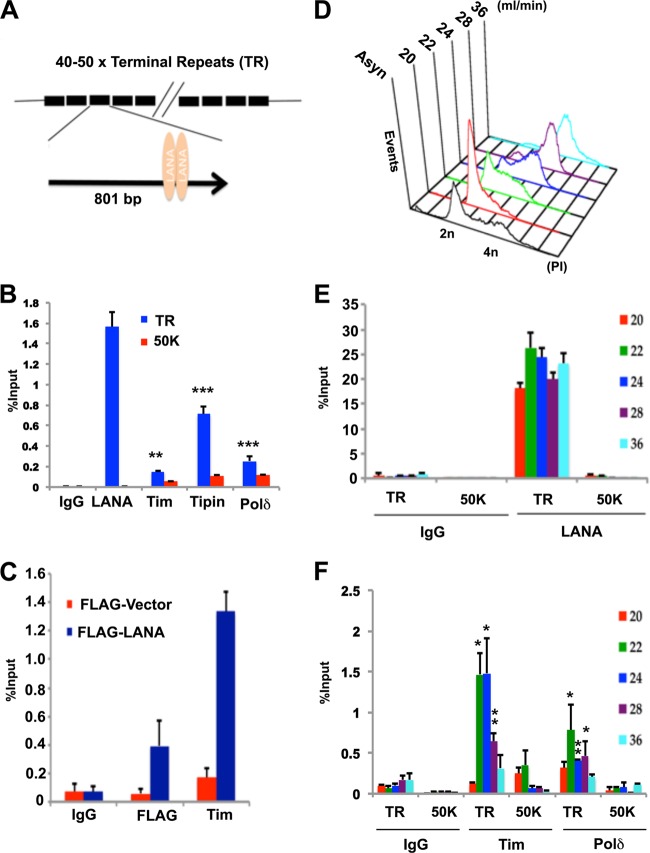
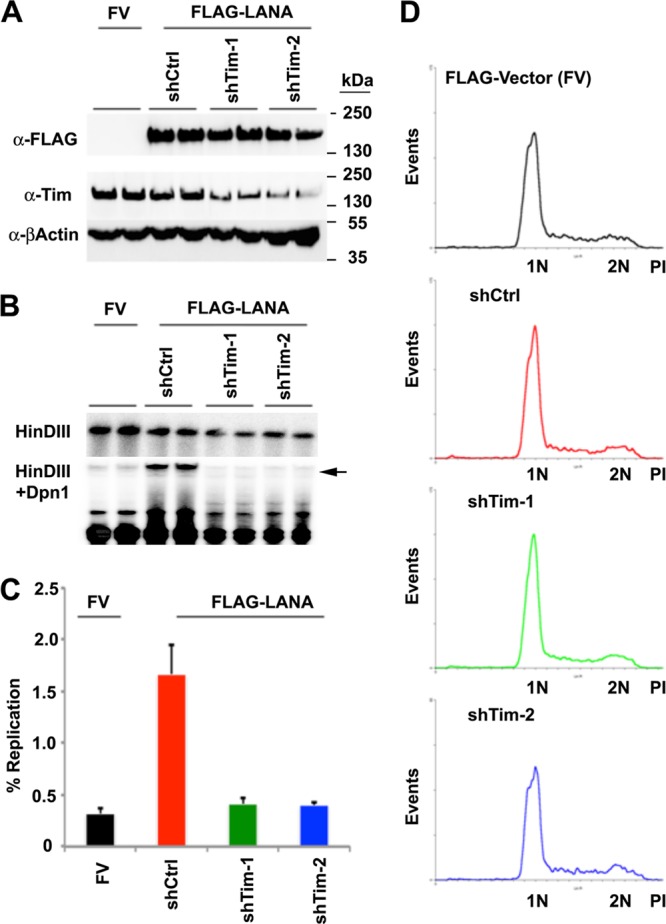
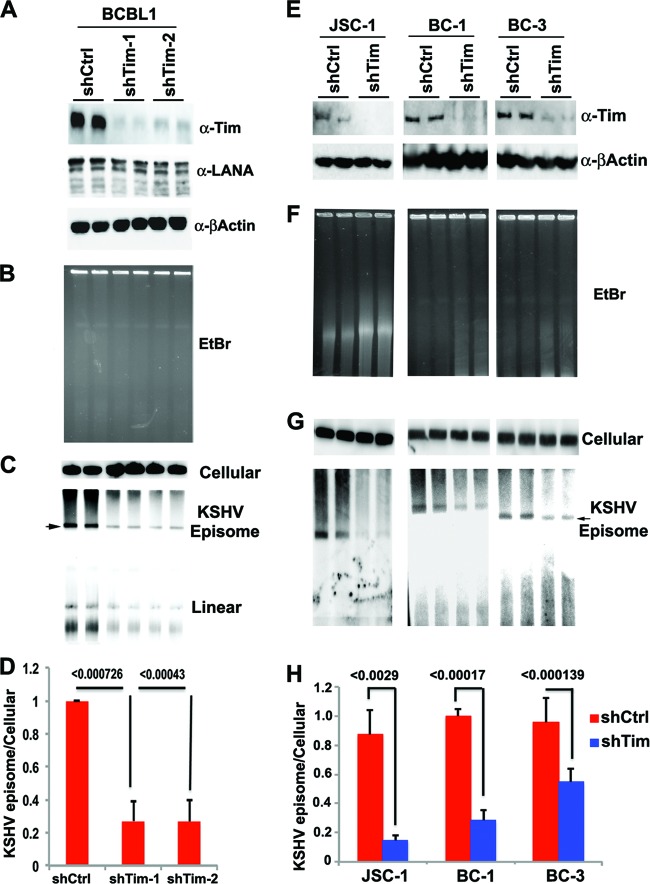
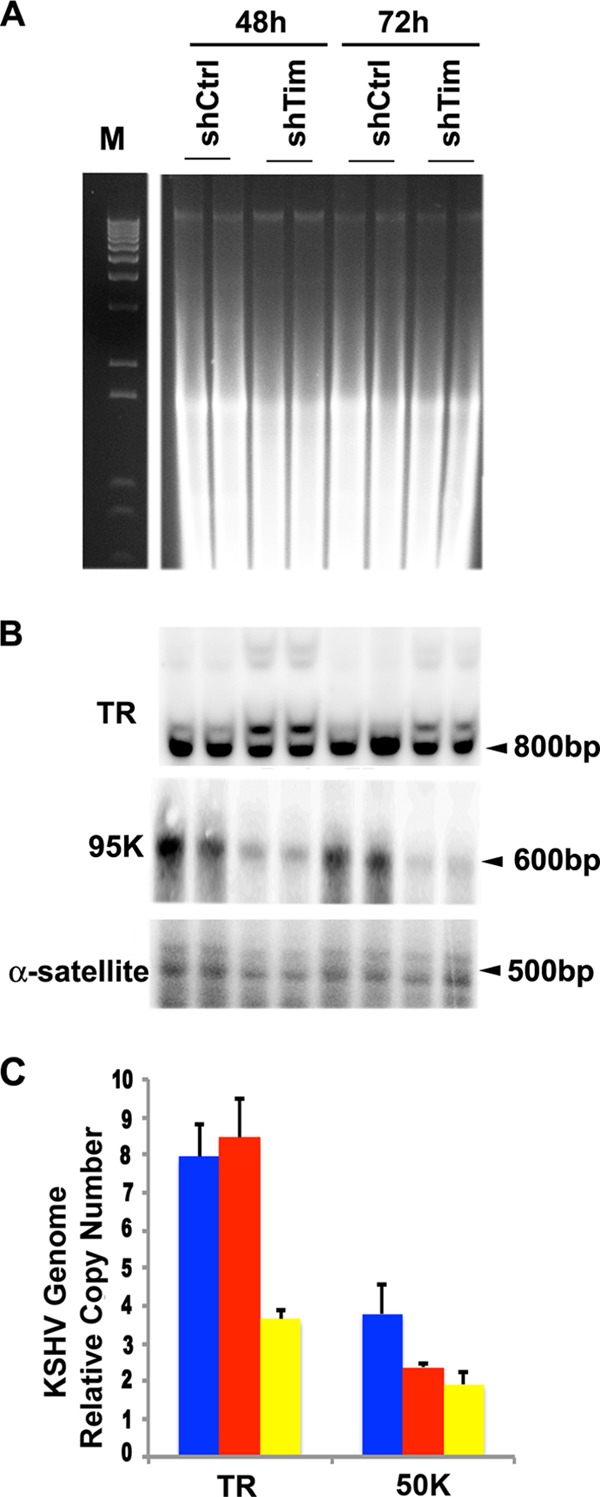
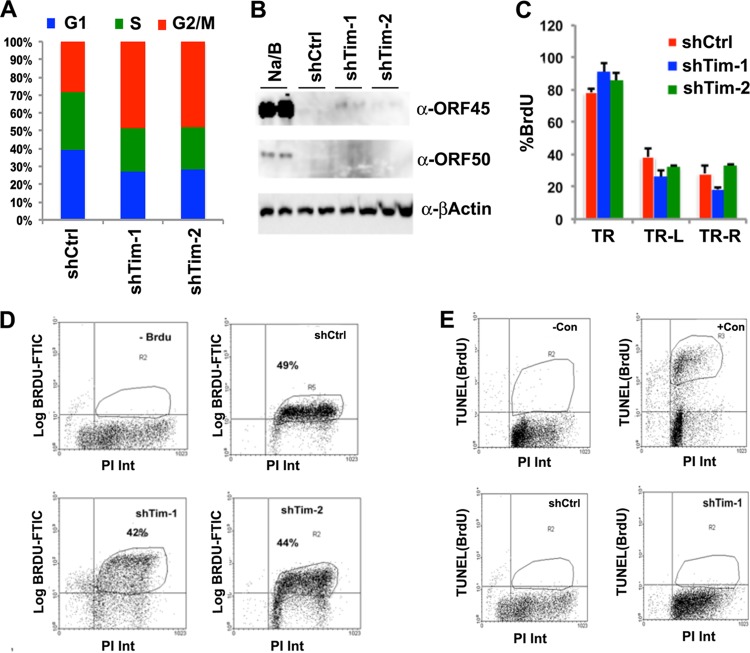
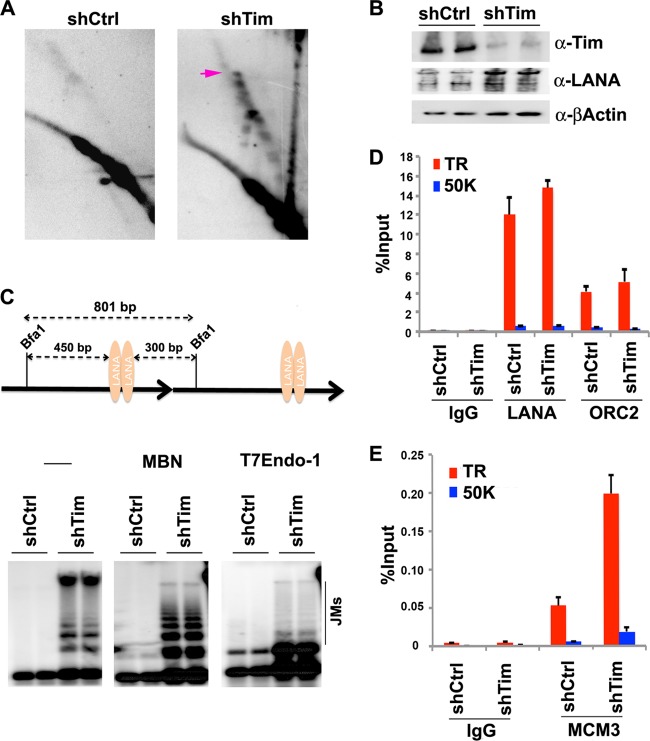
Kaposi's Sarcoma-associated herpesvirus (KSHV) is maintained as a stable episome in latently infected pleural effusion lymphoma (PEL) cells. Episome maintenance is conferred by the binding of the KSHV-encoded LANA protein to the viral terminal repeats (TR). Here, we show that DNA replication in the KSHV TR is coupled with DNA recombination and mediated in part through the cellular replication fork protection factors Timeless (Tim) and Tipin. We show by two-dimensional (2D) agarose gel electrophoresis that replication forks naturally stall and form recombination-like structures at the TR during an unperturbed cell cycle. Chromatin immunoprecipitation (ChIP) assays revealed that Tim and Tipin are selectively enriched at the KSHV TR during S phase and in a LANA-dependent manner. Tim depletion inhibited LANA-dependent TR DNA replication and caused the loss of KSHV episomes from latently infected PEL cells. Tim depletion resulted in the aberrant accumulation of recombination structures and arrested MCM helicase at TR. Tim depletion did not induce the KSHV lytic cycle or apoptotic cell death. We propose that KSHV episome maintenance requires Tim-assisted replication fork protection at the viral terminal repeats and that Tim-dependent recombination-like structures form at TR to promote DNA repeat stability and viral genome maintenance.


Figures

Fig 1
Fig 1
Analysis of replication and recombination intermediates of TRs. (A) Schematic of the 8.3-kb DNA fragment containing the 8 TR sequences used for 2D gel analysis. (B) Cartoon interpretation of the major TR DNA replication and recombination structures observed in the 2D gels shown in panel D. (C) BJAB cells containing a p8×TR plasmid were fractionated by centrifugal elutriation and then assayed by FACS analysis of PI-stained cells. The x axis is the PI intensity (DNA content), and the y axis is the cell number (events). (D) Two-dimensional neutral agarose gel analysis of 8×TRs isolated using the CTAB method from asynchronous (Asyn) BJAB cells after cell cycle fractionation. Replication fork pausing (purple arrows), recombination structures (yellow arrows), and replication bubbles (red arrows) are indicated.
Fig 2
Fig 2
Evidence for recombination junctions formed at TRs. (A and B) BCBL1 cells were cell cycle fractionated by centrifugal elutriation as in Fig. 1C. DNA was extracted from fractions 22 (G1/S), 26 (early S), 28 (mid-S), and 36 (G2/M) with (+) or without (−) CTAB to stabilize recombination-like structures. DNA was isolated and cleaved by BfaI and then analyzed by Southern blotting from a one-dimensional agarose gel with probes for the TR (A) or control probe from the KSHV 95000 region (B). The positions of the expected 1×TR products are indicated by arrowheads. Recombination-generated joint molecules (JMs) of >1-TR size are indicated. (C) DNA was extracted from BCBL1 cells collected in elutriation fraction 26 (mid-S phase) with CTAB, digested with Bfa1, and then mock treated (lanes 1 and 2 from left; −) or treated with MBN (lanes 3 and 4) or with T7endo (lanes 5 and 6). DNA fragments were visualized by Southern blotting with a probe for the TR. Arrowheads indicate a 1× 801-bp TR fragment.
Fig 3
Fig 3
Replication fork pausing factor TIM associates with the TR region of KSHV. (A) Schematic of KSHV TR organization and LANA-binding sites within each TR. (B) ChIP assay of BCBL1 cells with antibodies to LANA, Tim, Tipin, Polδ, or control IgG. ChIP DNA was analyzed by quantitative PCR (qPCR) with primers specific for the TR or the 50000 region. (C) 293 cells were transfected with p2xTR with either pFLAG-LANA or the pFLAG vector control and then assayed by ChIP at 72 h posttransfection. ChIP was performed with antibodies against FLAG, Tim, or control IgG and assayed for TR DNA by real-time PCR. (D) BCBL1 cells were fractionated by centrifugal elutriation and then assayed by PI staining and FACS. (E) ChIP assay with anti-LANA or control IgG at the TR region or the control 50000 region for each stage of the cell cycle, as indicated. (F) ChIP assays with antibody to Tim, Polδ, or control IgG were performed with primers for TR or the control 50000 region for each stage of the cell cycle, as indicated. The error bars represent standard deviations from the mean for at least three experimental replicates. P values were calculated by two-tailed t tests comparing the TR to control regions for relevant elutriation fractions. *, P < 0.05; **, P < 0.01; ***, P < 0.001.
Fig 4
Fig 4
Inhibition of TR DNA replication by Tim depletion. (A) Western blot of cell extracts from 293 cells transfected with FV or FLAG-LANA expression vectors and with plasmid expression vectors for shCtrl, shTim-1, or shTim-2, as indicated above each lane. Western blots were probed with antibodies to FLAG (α-FLAG) (top), Tim (middle), or β-actin (bottom). (B) Transient DNA replication assay for p8xTR plasmid in 293 cells cotransfected with FV or FLAG-LANA with or without shTim plasmid cotransfection. Plasmid DNA was isolated 72 h posttransfection and subjected to restriction enzyme digestion with DpnI-HinDIII (bottom) or HinDIII alone (top). The arrow indicates DpnI-resistant replicated 8×TR DNA. (C) Quantification of the ratio between DpnI-resistant and total HinDIII-cut DNA to measure the percentage of 8-TR DNA replication. The error bars indicate standard deviations for three experimental replicates. (D) FACS analysis of PI-stained cells for cell cycle profile analysis of shCtrl- and shTim-transfected cells used for replication assays shown in panel B.
Fig 5
Fig 5
Loss of KSHV episomal form in PEL cells after Tim depletion. (A) BCBL1 cells were infected with shCtrl, shTim-1, or shTim-2 and then assayed by Western blotting for Tim (top), LANA (middle), or β-actin (bottom). (B) Ethidium bromide (EtBr) staining of PFGE gels of BCBL1 cells after infection with shCtrl or shTim lentiviruses for 72 h. (C) A Southern blot of PFGE gels was probed in cellular α-satellite DNA (top) or the KSHV TR region (bottom). Episomes and linear forms of KSHV genomes are indicated. (D) Quantification of the percentage of episomal DNA loss between shCtrl- and shTim-treated cells relative to α-satellite DNA as determined by PhosphorImager analysis. P values were determined by a chi-square test. (E) KSHV-positive PEL cell lines JSC-1, BC-1, and BC-3 were infected with shCtrl or shTim for 72 h and then assayed by Western blotting for Tim (top) or β-actin (bottom). (F) EtBr staining of PFGE for JSC-1, BC-1, and BC-3 cells at 72 h after lentivirus infection. (G) A Southern blot of PFGE gels was probed in cellular α-satellite DNA (top) or the KSHV TR region (bottom). KSHV episomal genomes are indicated. (H) Quantification of the percentage of KSHV episomal DNA loss between shCtrl and shTim relative to cellular α-satellite as determined by PhosphorImager analysis of PFGE. P values were determined by a chi-square test. The error bars indicate standard deviations.
Fig 6
Fig 6
Selective loss of KSHV DNA from BCLB1 cells. (A) DNA from BCLB1 cells treated with shCtrl or shTim for 48 or 72 h was isolated by a total genomic DNA isolation procedure, followed by digestion with BfaI, and then analyzed by ethidium bromide staining after agarose gel electrophoresis (right). M, molecular weight markers. (B) A Southern blot of the same gel as in panel A was probed with TR (top), KSHV 95000 (middle), or cellular α-satellite repeat (bottom) DNA. (C) The KSHV genome copy number was determined from DNA isolated from BCBL1 cells after infection with shCtrl or shTim for 48 or 72 h and assayed by real-time PCR with primers specific for the TR or 95000 region relative to β-actin DNA using the ΔCt method. The error bars indicate standard deviations.
Fig 7
Fig 7
Tim depletion does not cause cell cycle arrest, apoptosis, or lytic reactivation of KSHV in BCBL1 cells. (A) BCBL1 cells were infected with shCtrl, shTim-1, or shTim-2 for 48 h and then stained with PI for FACS analysis. The cell cycle distribution is presented graphically as percentages of total cells in G1, S, and G2/M. (B) Western blot analysis of KSHV lytic proteins Rta and ORF45 and control actin for BCBL1 cells after infection with shCtrl or shTim or after treatment with tetradecanoyl phorbol acetate (TPA) and NaB for 48 h, as indicated. (C) BrdU-IP assay for BCBL1 cells after infection with shCtrl or shTim. BrdU incorporation was assayed by qPCR at KSHV locations for TRs, TR-L, and TR-R, as indicated. The error bars indicate standard deviations from the mean, and P values were determined by a chi-square test. (D) The percentages of cells undergoing DNA synthesis were measured by pulse-labeling with BrdU for 30 min, followed by staining with PI. BrdU intensity (Int) was monitored by anti-BrdU-conjugated fluorescein isothiocyanate (FITC) (y axis), and PI was monitored on the x axis. Shown are BCBL1 cells with no BrdU control (top left), shCtrl (top right), shTim-1 (bottom left), or shTim-2 (bottom right). (E) Apoptotic cells were quantified using the Apo-BrdU TUNEL assay. Control samples were camptothecin treated (+Con) or untreated (−Con) HL60 cells provided by the manufacturer (top). BCBL1 cells 48 h postinfection with shCtrl (bottom left) or shTim-1 (bottom right) are also shown. FACS analyses were performed for two independent experiments, and a representative experiment is shown.
Fig 8
Fig 8
Tim depletion causes accumulation of paused replication and recombination structures at the TR. (A) 2D neutral agarose gel electrophoresis and Southern blot analysis of p8xTR DNA in BJAB cells after infection with shCtrl (left) or shTim (right) lentivirus for 48 h. The arrow indicates the migration of recombination-like structures. (B) Western blot of cells used for pulsed-field analysis. Antibodies for Tim (top), LANA (middle), and β-actin (bottom) are indicated. (C) Scheme of 0.8-kb Bfa1-digested TR fragment (top) used for 1D gel analysis of replication and recombination structures (bottom). DNA was extracted from shCtrl- or shTim-infected cells with CTAB, digested with Bfa1, and then mock treated (lanes 1 to 4 from left; −) or treated with MBN (lanes 5 to 8) or with T7endo (lanes 9 to 12), as indicated. DNA fragments were visualized by Southern blotting with a probe for the TR. Recombination-generated JMs are indicated. (D) ChIP assays with anti-LANA, anti-ORC2, or control IgG were performed with primers for the TR region or the control 50000 region for shCtrl or shTim, as indicated. (E) ChiP assay as in panel D with anti-MCM3 or control IgG. The error bars represent standard deviations from the mean for at least three experimental replicates.

Similar articles

Cited by

References

    1. Parkin DM. 2006. The global health burden of infection-associated cancers in the year 2002. Int. J. Cancer 118:3030–3044 - PubMed
    1. Butel JS, Fan H. 2012. The diversity of human cancer viruses. Curr. Opin. Virol. 2:449–452 - PubMed
    1. Martin D, Gutkind JS. 2008. Human tumor-associated viruses and new insights into the molecular mechanisms of cancer. Oncogene 27(Suppl. 2):S31–S42 - PubMed
    1. Moore PS, Chang Y. 2010. Why do viruses cause cancer? Highlights of the first century of human tumour virology. Nat. Rev. Cancer 10:878–889 - PMC - PubMed
    1. Chang Y, Cesarman E, Pessin MS, Lee F, Culpepper J, Knowles DM, Moore PS. 1994. Identification of herpesvirus-like DNA sequences in AIDS-associated Kaposi's sarcoma. Science 266:1865–1869 - PubMed

Publication types

MeSH terms

LinkOut - more resources