

Systems-level analysis of genome-wide association data
- PMID: 23316444
- PMCID: PMC3538337
- DOI: 10.1534/g3.112.004788
Systems-level analysis of genome-wide association data
Abstract
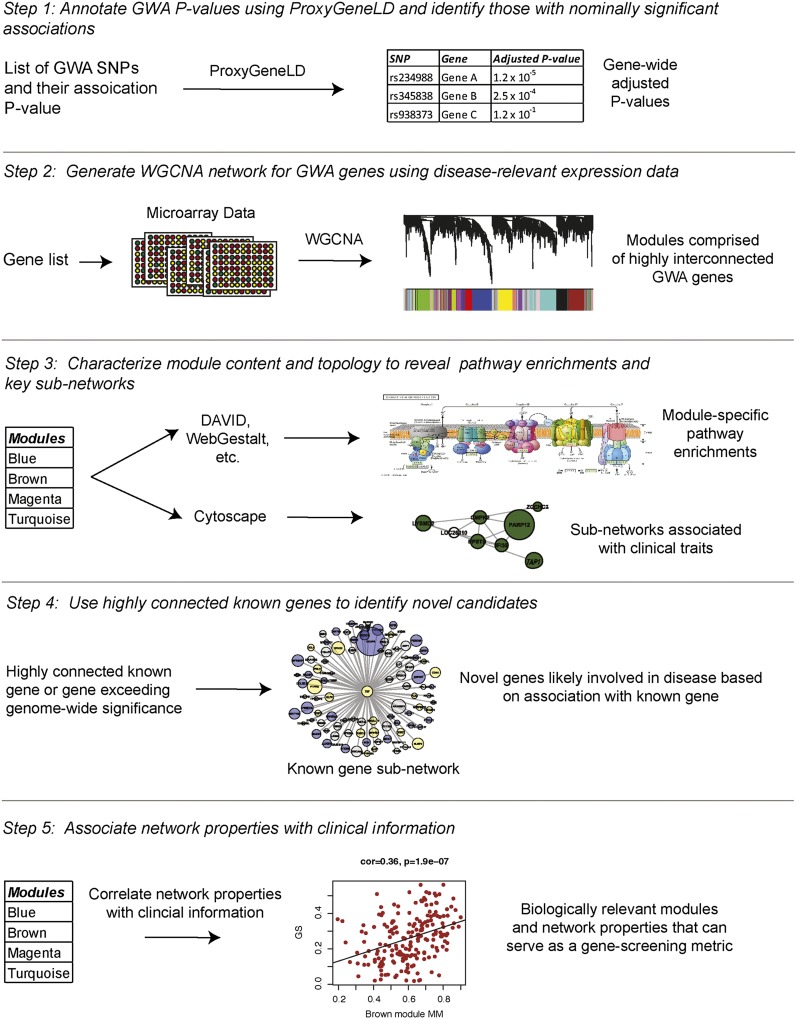
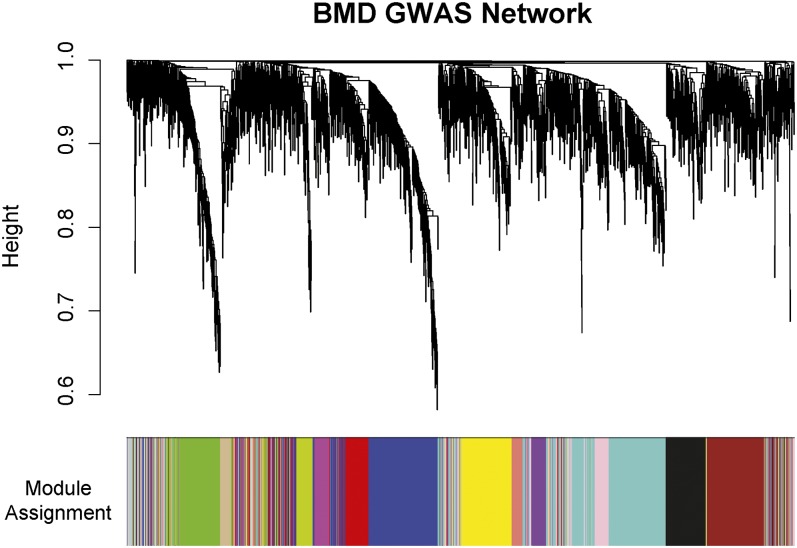
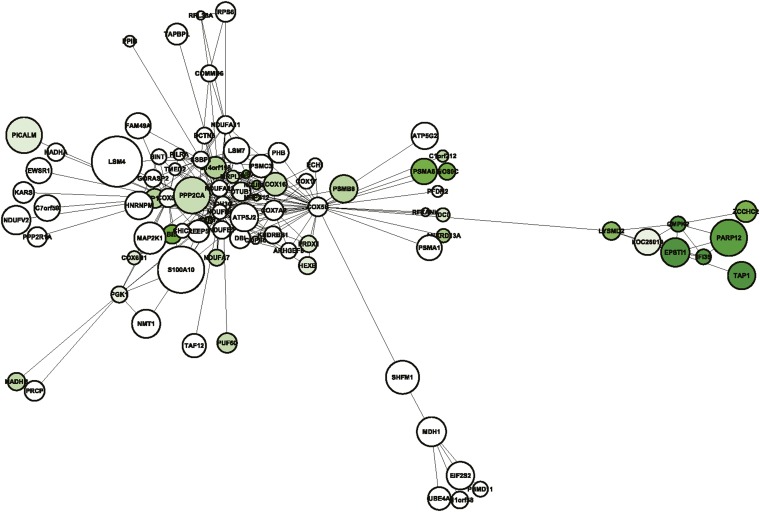
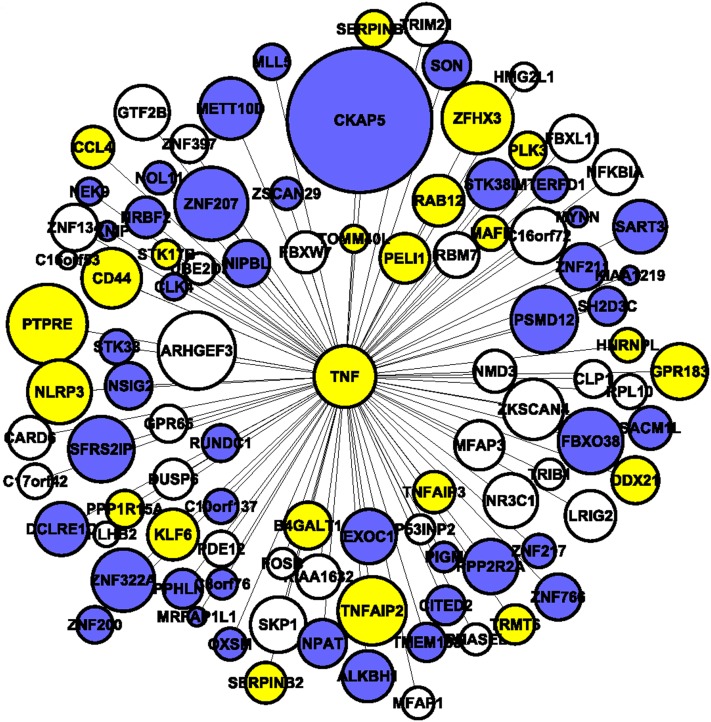
Genome-wide association studies (GWAS) have emerged as the method of choice for identifying common variants affecting complex disease. In a GWAS, particular attention is placed, for obvious reasons, on single-nucleotide polymorphisms (SNPs) that exceed stringent genome-wide significance thresholds. However, it is expected that many SNPs with only nominal evidence of association (e.g., P < 0.05) truly influence disease. Efforts to extract additional biological information from entire GWAS datasets have primarily focused on pathway-enrichment analyses. However, these methods suffer from a number of limitations and typically fail to lead to testable hypotheses. To evaluate alternative approaches, we performed a systems-level analysis of GWAS data using weighted gene coexpression network analysis. A weighted gene coexpression network was generated for 1918 genes harboring SNPs that displayed nominal evidence of association (P ≤ 0.05) from a GWAS of bone mineral density (BMD) using microarray data on circulating monocytes isolated from individuals with extremely low or high BMD. Thirteen distinct gene modules were identified, each comprising coexpressed and highly interconnected GWAS genes. Through the characterization of module content and topology, we illustrate how network analysis can be used to discover disease-associated subnetworks and characterize novel interactions for genes with a known role in the regulation of BMD. In addition, we provide evidence that network metrics can be used as a prioritizing tool when selecting genes and SNPs for replication studies. Our results highlight the advantages of using systems-level strategies to add value to and inform GWAS.
Keywords: coexpression network; genome-wide association study (GWAS); osteoporosis; systems biology.
Figures
Similar articles
-
Identification of a gene module associated with BMD through the integration of network analysis and genome-wide association data.J Bone Miner Res. 2010 Nov;25(11):2359-67. doi: 10.1002/jbmr.138. J Bone Miner Res. 2010. PMID: 20499364
-
Integrative analysis of GWASs, human protein interaction, and gene expression identified gene modules associated with BMDs.J Clin Endocrinol Metab. 2014 Nov;99(11):E2392-9. doi: 10.1210/jc.2014-2563. Epub 2014 Aug 13. J Clin Endocrinol Metab. 2014. PMID: 25119315 Free PMC article.
-
Integrative Analysis of Genomics and Transcriptome Data to Identify Potential Functional Genes of BMDs in Females.J Bone Miner Res. 2016 May;31(5):1041-9. doi: 10.1002/jbmr.2781. Epub 2016 Feb 6. J Bone Miner Res. 2016. PMID: 26748680
-
Dissecting the Genetics of Osteoporosis using Systems Approaches.Trends Genet. 2019 Jan;35(1):55-67. doi: 10.1016/j.tig.2018.10.004. Epub 2018 Nov 20. Trends Genet. 2019. PMID: 30470485 Free PMC article. Review.
-
Using "-omics" Data to Inform Genome-wide Association Studies (GWASs) in the Osteoporosis Field.Curr Osteoporos Rep. 2021 Aug;19(4):369-380. doi: 10.1007/s11914-021-00684-w. Epub 2021 Jun 14. Curr Osteoporos Rep. 2021. PMID: 34125409 Free PMC article. Review.
Cited by
-
Transcriptome Analysis of Populus euphratica under Salt Treatment and PeERF1 Gene Enhances Salt Tolerance in Transgenic Populus alba × Populus glandulosa.Int J Mol Sci. 2022 Mar 28;23(7):3727. doi: 10.3390/ijms23073727. Int J Mol Sci. 2022. PMID: 35409087 Free PMC article.
-
Identification of Atrial Fibrillation-Associated Genes ERBB2 and MYPN Using Genome-Wide Association and Transcriptome Expression Profile Data on Left-Right Atrial Appendages.Front Genet. 2021 Jun 30;12:696591. doi: 10.3389/fgene.2021.696591. eCollection 2021. Front Genet. 2021. PMID: 34276800 Free PMC article.
-
Connecting Anxiety and Genomic Copy Number Variation: A Genome-Wide Analysis in CD-1 Mice.PLoS One. 2015 May 26;10(5):e0128465. doi: 10.1371/journal.pone.0128465. eCollection 2015. PLoS One. 2015. PMID: 26011321 Free PMC article.
-
Data Integration in Poplar: 'Omics Layers and Integration Strategies.Front Genet. 2019 Sep 25;10:874. doi: 10.3389/fgene.2019.00874. eCollection 2019. Front Genet. 2019. PMID: 31608114 Free PMC article. Review.
-
Network.assisted analysis to prioritize GWAS results: principles, methods and perspectives.Hum Genet. 2014 Feb;133(2):125-38. doi: 10.1007/s00439-013-1377-1. Hum Genet. 2014. PMID: 24122152 Free PMC article. Review.
References
-
- Askland K., Read C., Moore J., 2009. Pathways-based analyses of whole-genome association study data in bipolar disorder reveal genes mediating ion channel activity and synaptic neurotransmission. Hum. Genet. 125: 63–79 - PubMed
-
- Blair H. C., 1998. How the osteoclast degrades bone. Bioessays 20: 837–846 - PubMed
Publication types
MeSH terms
Associated data
- Actions
Grants and funding
LinkOut - more resources
Full Text Sources
Other Literature Sources
Medical