. 2013 Feb 1;41(4):2216-27.
doi: 10.1093/nar/gks1441. Epub 2013 Jan 8.

Space exploration by the promoter of a long human gene during one transcription cycle

Affiliations

Space exploration by the promoter of a long human gene during one transcription cycle

Joshua D Larkin et al. Nucleic Acids Res. .

Abstract

An RNA polymerase has been thought to transcribe by seeking out a promoter, initiating and then tracking down the template. We add tumor necrosis factor α to primary human cells, switch on transcription of a 221-kb gene and monitor promoter position during the ensuing transcription cycle (using RNA fluorescence in situ hybridization coupled to super-resolution localization, chromosome conformation capture and Monte Carlo simulations). Results are consistent with a polymerase immobilized in a 'factory' capturing a promoter and reeling in the template, as the transcript and promoter are extruded. Initially, the extruded promoter is tethered close to the factory and so likely to re-initiate; later, the tether becomes long enough to allow re-initiation in another factory. We suggest close tethering underlies enhancer function and transcriptional 'bursting'.


Figures

Figure 1.
Figure 1.
The first transcription cycle of SAMD4A after stimulation with TNFα. The cartoon illustrating results obtained previously using microarrays (15). HUVECs were treated with TNFα for different times, and total RNA applied to a tiling microarray spanning 221-kb SAMD4A; the map illustrates probes and their targets, which are named by distance in kb from the TSS (open circle). Before stimulation (0 min), no signal is detected. After 10 min, nascent RNA (gray, detected by Probe 2) appears at the promoter, indicative of rapid and synchronous initiation. The pioneering polymerase (oval) then transcribes steadily to reach Target 34 after 30 min, 45 after 45 min and eventually 190 after 82.5 min; this generates a ‘traveling’ wave that sweeps down the gene. After 10 min, an additional polymerase reinitiates but terminates prematurely (circular dotted arrow); a succession of such non-productive initiations create a ‘standing’ wave within 10 kb of the TSS. Thereafter, the gene is transcribed by two polymerases contributing respectively to the ‘traveling’ and ‘standing’ waves. The standing wave peaks at 30 min.
Figure 2.
Figure 2.
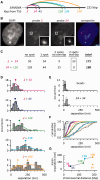
Measured distances between pairs of nascent RNAs copied from one SAMD4A allele. HUVECs were treated with TNFα for 30–82.5 min, RNA FISH performed (using Probe 2 in a pairwise combination with Probe 34, 45, 128, 138 or 190 at 30, 45, 52.5, 60 or 82.5 min after stimulation—or Probes 34 + 128 at 45 min) and separations between probes determined with 30-nm precision. (A) Map of SAMD4A, indicating pairwise probe combinations (34 + 128 excluded). (B) Typical images of one nucleus obtained 30 min after stimulation. Bar: 2 µm (insets 500 nm, 90-nm pixels). (C) Some typical results. With probes 2 + 34 (30 min post-stimulation), 56% cells yield no signal, 20% cells give a single spot (either from Probe 2 or 34), 5% cells give non-overlapping spots (and thus mark transcripts copied from different alleles) and 19% cells yield overlapping signals; when Probe 2 is used in pairwise combinations with each of the other probes indicated in (A), essentially similar numbers are obtained. With Probe 34 + 128 (45 min post-stimulation), a similar percentage of cells with no signal (68%) is obtained, but no cells yield overlapping signals (confirming that these probes target two different RNA molecules). (D) The separation (nm) seen between Probe 2 and the second in the pair measured using images like those in (B). Histograms (30-nm bins; 40, 42, 26, 32 and 42 yellow foci analyzed for the examples given from top to bottom) illustrate the number of times a separation was seen (occurrence). Gaussian distributions are fitted to histograms and normalized by equalizing areas under curves to allow direct comparison of probabilities (circles indicate means). For 2 + 190, the histogram was also fitted with a bi-modal distribution (dotted line) and the left component plotted as a uni-modal distribution (diamond indicates mean). (E) Occurrences given by multispectral 100-nm beads (where the expected separation is zero if channel registration and localization are perfect), and a mixed red + green probe (34 + 34 used 30 min after stimulation) targeting the same region (which gives a slightly larger separation owing to the use of an odd number of oligomers in the probe set). (F) Cumulative occurrence (gray steps) with fitted curves color-coded as in panel (D). The curve for 2 + 138 (light blue) is closer to that for 2 + 190 (beige) than that for 2 + 128 (green), despite 138 being closer to 128. When 2 + 190 is fitted with a bi-modal distribution, the left component (orange) closely matches the curves given by 2 + 34 (red) and 2 + 45 (dark blue). (G) Mean separations, color- and shape-coded as in panel (D), plotted as a function of chromosomal distance (kb) between probe targets (diamond gives mean of left-hand component of bimodal distribution given by 2 + 190).
Figure 3.
Figure 3.
Comparing expected and observed separations (with map of SAMD4A). Experimental data and color-coding are as in Figure 2. (A) Separations seen between probe pairs, normalized to the mean value obtained with 2 + 34. If polymerases track along a linear template, we would expect normalized separations to increase in proportion to the number of bases transcribed (dashed line—‘Model I’); however, observed separations have a different behavior (gray line; fitted by linear regression to the RNA FISH data from Figure 2D). (B) Separations between two points on a randomly folded (self-avoiding) polymer without (Model II) and with (Model III) an attraction between beads to provide a good fit to the experimental data (gray line, + SEM; from Figure 2G). In ‘Model II’, different persistence lengths found in eu- or hetero-chromatin (i.e. 40 and 150 nm), and an intermediate value, are included. In Model III, a persistence length of only 40 nm was used.
Figure 4.
Figure 4.
An interpretation of results obtained by RNA FISH (with map of SAMD4A). (A) Before stimulation (when NFκB is absent), the SAMD4A promoter is rarely active, even though it may diffuse to a polymerase (oval) in a factory (sphere). (B) After 10 min, NFκB has entered the nucleus and promotes transcriptional initiation when the promoter collides with the polymerase in the factory (yielding an RNA FISH signal with Probe 2). (C) By 30 min, the pioneering polymerase has reeled in the template, as promoter and transcript are extruded. The promoter, being tethered close to the factory, can now reinitiate at a second polymerase—but this polymerase will soon abort. The separations given by Probes 2 + 34 are consistent with the two targets being randomly distributed on the surface of one factory. (D) As the pioneer polymerase transcribes, the length of the tether connecting the promoter to the factory increases. (E) At 50 min, Probe 128 yields a signal, and the tether is not long enough to reach a second factory. (F) By 60 min, the tether has grown sufficiently to allow the promoter to reinitiate at a polymerase in a secondary factory. (G) By 85 min, the promoter is initiating in the first (left) or the second factory (right)—this produces a wider distribution of measured separations in the population.
Figure 5.
Figure 5.
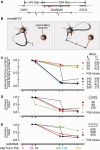
The development and growth of a subgene loop in SAMD4A. HUVECs were treated for 0–82.5 min with TNFα, and 3C coupled to qPCR performed using one primer targeting region 2 (anchor) and another targeting sites successively further 3′. In some cases, DRB was added 25 min before harvesting. The normalized interaction frequency (arbitrary units, a.u.) between the anchor and the sites indicated on the map is given. At 0 min (gray), the anchor rarely contacts other regions. By 30 min (red), it interacts strongly with Position 34 (a possible structure is indicated); however, it interacts less well with sites further away. After 52.5 min (green), it now interacts most strongly with Position 128 (a possible structure is indicated), and DRB abolishes all interactions (dotted line). By 82.5 min (orange), most contacts are with Position 190, but this frequency is ∼30% lower than the maximum seen at 30 or 52.5 min (two possible structures are indicated; the upper one does not yield a 3C product). Results are consistent with the appearance of a subgene loop that enlarges with time, and therefore with the model described in Figure 4.
Figure 6.
Figure 6.
Monte Carlo simulations analyzing how tethering affects association of the SAMD4A promoter with surrounding factories. (A) Map of the region around SAMD4A. 3C (not shown) shows the SAMD4A promoter contacts CNIH and GCH1 (promoters indicated as open diamonds). Distances l1 and l2 vary. (B) Model IV. The SAMD4A locus is modeled as a string of 30-nm beads (each representing 3 kb), tethered to a ‘primary’ factory (left) at three points (once within SAMD4A at one of the probe targets, and at l1 and l2 kb to the left and right, respectively); this factory is surrounded by six orthogonally positioned ‘secondary’ factories (only one shown; center-to-center distance, d). In the left-hand panel, the pioneering polymerase is transcribing region around Probe 2; the length of the tether connecting the promoter to the primary factory is so short that the promoter can never contact a secondary factory. In the right-hand panel, the pioneering polymerase is transcribing region around Probe 190; therefore, the tether is now long enough to allow the promoter to visit a secondary factory. A single simulation involves allowing such a structure to equilibrate, and—after >106 simulations involving >103 contacts for each condition analyzed—the fraction of contacts the promoter makes with the primary factory is expressed relative to the contacts made with all seven factories. Conditions analyzed included varying l1 and l2, persistence length (ξ) and inter-factory distance (d). In the panels below, values of l1, l2, ξ and d expected to be found in vivo provide the best fit to the RNA FISH data in Figure 2D (included for comparison, assuming that ‘occurrences’ seen between 0 and 160 nm and 0 and 500 nm reflect ‘primary factory contacts’ and ‘total factory contacts’, respectively). (C) Varying distance (l1 and l2 in kb) to flanking attachment points (when d = 450 nm and ξ = 40 nm). With the distances found in vivo (l1 = 141, l2 = 334; black), the SAMD4A promoter can only visit a secondary factory (indicated by a reduced fraction) when the body of the gene is attached at Position 128, 138 or 190. As intuition suggests, shortening l1 limits access to a secondary factory, whereas varying l2 has little effect. In (C) and (D), error bars are contained within the symbols. (D) Varying persistence length (when l1 = 141, l2 = 334 and d = 450 nm). Stiffening the fiber reduces the visits of the SAMD4A promoter to secondary factories. (E) Varying distance between factories (when l1 = 141, l2 = 334 and ξ = 40 nm). As distance between factories increases, the frequency that the fiber visits a secondary factory decreases.

Similar articles

Cited by

References

    1. Alberts B, Johnson A, Lewis J, Raff M, Roberts K, Walter P. Molecular Biology of the Cell. New York: Garland Science; 2002.
    1. Jackson DA, Hassan AB, Errington RJ, Cook PR. Visualization of focal sites of transcription within human nuclei. EMBO J. 1993;12:1059–1065. - PMC - PubMed
    1. Chakalova L, Fraser P. Organization of transcription. Cold Spring Harb. Perspect. Biol. 2010;2 a000729. - PMC - PubMed
    1. Cook PR. A model for all genomes: the role of transcription factories. J. Mol. Biol. 2010;395:1–10. - PubMed
    1. Eskiw CH, Rapp A, Carter DR, Cook PR. RNA polymerase II activity is located on the surface of protein-rich transcription factories. J. Cell Sci. 2008;121:1999–2007. - PubMed

Publication types