. 2013;8(1):e52233.
doi: 10.1371/journal.pone.0052233. Epub 2013 Jan 2.

Gleevec, an Abl family inhibitor, produces a profound change in cell shape and migration

Affiliations

Gleevec, an Abl family inhibitor, produces a profound change in cell shape and migration

Zaozao Chen et al. PLoS One. 2013.

Abstract

The issue of how contractility and adhesion are related to cell shape and migration pattern remains largely unresolved. In this paper we report that Gleevec (Imatinib), an Abl family kinase inhibitor, produces a profound change in the shape and migration of rat bladder tumor cells (NBTII) plated on collagen-coated substrates. Cells treated with Gleevec adopt a highly spread D-shape and migrate more rapidly with greater persistence. Accompanying this more spread state is an increase in integrin-mediated adhesion coupled with increases in the size and number of discrete adhesions. In addition, both total internal reflection fluorescence microscopy (TIRFM) and interference reflection microscopy (IRM) revealed a band of small punctate adhesions with rapid turnover near the cell leading margin. These changes led to an increase in global cell-substrate adhesion strength, as assessed by laminar flow experiments. Gleevec-treated cells have greater RhoA activity which, via myosin activation, led to an increase in the magnitude of total traction force applied to the substrate. These chemical and physical alterations upon Gleevec treatment produce the dramatic change in morphology and migration that is observed.


Conflict of interest statement

Competing Interests: The authors have declared that no competing interests exist.

Figures

Figure 1
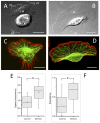
Figure 1. Transformation of NBT-II cells morphology and migratory phenotype after Gleevec treatment.
A and B) Representative DIC images of NBT-II cells plated on 10 µg/ml collagen coated substrate. Control cell (A) and cell treated for 30 min with 20 µM Gleevec. (B) Note that a lamellipodial protrusion and a D- (or fan) shaped morphology occurs within 10 minutes of exposure to the Abl-family inhibitor. Lamellae (Marked with “LM”), lamellipodia (Marked with “LP”), filopodia (Marked with “FP”) and retraction fibers (Marked with “RF”) were labeled accordingly. (C and D) Confocal fluorescent images of the f-actin (Rhodamine-phalloidin, Red) and microtubules (alpha-tubulin antibody, Green) in the control (C) and Gleevec-treated cells (D). (E and F) Box and whisker plots of the average cell migration speed (E) and directional persistence (F) for the control group (N = 60) and NBT-II cells treated with 20 µM Gleevec (N = 60). Standard deviations are indicated by the box sizes; maximum and minimum data values are indicated by the extent of the whiskers. The bar and the square inside the box are the median and mean value respectively. Gleevec-treated NBTII cells migrate significantly faster and are more persistent in their directionality (* p<0.001, by students t-test). Scale bars are 20 µm.
Figure 2
Figure 2. Detailed analysis of cell morphology changes after Gleevec treatment.
A) Cell morphology parameters (see text) were analyzed and compared between NBT-II cells from the control group and the group treated with 20 µM Gleevec. B) Schematic figures depicting the calculation of each cell morphology parameter. The 1st and 4th cells from the left, shown in panel B, are samples of control NBT-II cells; while the 2nd and 3rd cells depict NBT-II cells that have been treated with Gleevec. Data are calculated from more than 50 cells for each group. Error bars indicate standard deviations. Control and Gleevec treated cells are significantly different in all four parameters (* indicates p<0.001, by student's t-test).
Figure 3
Figure 3. NBTII cell migration behavior depends on substrate adhesiveness and Gleevec concentration.
A) and B) Graphs depicting the average cell migration speed (A) and persistence (B) of NBT-II cells from the control group (no inhibitor) and NBT-II cells treated with different concentrations of Abl family kinase inhibitor (Gleevec). Cells were cultured on 10 µg/ml collagen coated substrates. Gleevec concentration has significant effect to both cell migration speed and persistence (ANOVA, p<0.05). Cells treated with 5 µM or 20 µM Abl kinase inhibitor migrated significantly than control cells, while 20 µM and 50 µM group also migrated more persistently than control cells. The significance between control and each Gleevec treated groups was tested by one-way ANOVA followed by Bonferroni's post hoc test, (*) p<0.05. C) and D) Graphs depicting the average cell migration speed (C) and persistence (D) of NBT-II cells on substrates coated with 1 µg/ml, 10 µg/ml, and 100 µg/ml collagen. The average migration speed and persistence of control and Gleevec cells are presented with gray and black bars, respectively. Significance of differences in migration speed and persistence between control and Gleevec treated cells were marked in the figure (* p<0.001, by students t-test). For all panels (A–D), results are calculated from more than 30 cells in each group. The error bars indicate standard deviations.
Figure 4
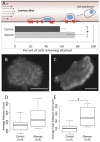
Figure 4. Gleevec-treated cells are more adhesive than control cells.
A) A schematic figure (top panel) showing the measurement of cell adhesion strength using a laminar flow system. As the laminar flow rate is increased, more cells detach. Cells were cultured for 4 hours on 10 µg/ml pre-coated collagen Nunc SlideFlask (Thermo) substrates. The fraction of adherent cells remaining after exposure to shear stress of 200 dynes/cm2 for 1 min (N = 5; n = 11–20 images per N) is shown in the horizontal bar graph The group of cells treated with 20 µM of Gleevec has significantly higher number of remaining cells after laminar flow exposure (* indicates p<0.05 by the students t-test). B) and C) are representative GFP-Paxillin TIRF images for control NBT-II cells and Gleevec-treated NBT-II cells, respectively. Scale bars are 20 µm. D) and E) The average number of adhesions (D) in control and Gleevec-treated cells and the average total area of the adhesions (E) (* indicates p<0.01 by the students t-test). Error bars indicate standard deviations. Cell counts (n) are listed in the figure.
Figure 5
Figure 5. Punctuate adhesions are present at the leading edge of Gleevec-treated NBT-II cells.
Panel A) and E) are representative interference reflection images of a migrating control (A) and a Gleevec-treated (E) NBT-II cell, respectively. Dense, dynamic, punctuate adhesions are only observed at the leading edge of the Gleevec-treated cells. Red rectangles on (A) and (E) show the position where thee times magnified images (B) and (F) were taken. Panel C) and G) are representative TIRF images of GFP-Paxillin expressed in control and Gleevec-treated NBT-II cells, respectively. D) and H) Images resulting from amplifying the areas indicated by the red boxes in C) and G) by three times, respectively. Gleevec-treated cells form a band of GFP-Paxillin at the leading edge of the cell. The GFP-Paxillin fluorescent intensity is measured along yellow dotted lines (shown in Figure 5C and 5G) across the leading edge of the cell (4 lines for each cell). I) Multiple cells were used to calculate the distribution of normalized GFP-Paxillin intensity at the leading edge: control NBT-II cells (Black line, n = 12), and D-shaped Gleevec-treated NBT-II cells (red line, n = 12), with the standard deviation shown as gray (for control cells) or pink bars (for Gleevec-treated cells) (detailed calculations are described in Materials and Methods). Gleevec-treated cells NBT-II cells have peak of GFP-Paxillin signal near the leading edge, while control NBT-II cells do not. Scale bars in panels A, C, E and G are 20 µm, and in B, D, F, H are 5 µm. Error bars indicate standard deviations.
Figure 6
Figure 6. Blocking of integrin related adhesion dramatically inhibits the migration speed of Gleevec-treated NBT-II cells.
A) Migration speed of Gleevec-treated cells incubated with either beta1-integrin blocking antibody (1 µg/ml) or an RGD-containing peptide (100 µg/ml). Migration speed was measured 30 minutes after addition of beta1-Integrin blocking antibody or RGD containing peptide (n>10 for each group). Panels B–D) are DIC images of an NBT-II cell treated with Gleevec (20 µM) migrating on a 10 µg/ml collagen-coated substrate, and then treated with 1 µg/ml RGD containing peptide. Images before addition of RGD containing, 2 minutes after and 5 minutes after addition of the RGD peptide are shown. Scale bars are 20 µm. Error bars indicate standard deviations. The statistical significance of difference between control cells with and without RGD, and difference between Gleevec treated cells with and without integrin blocking antibody or RGD is indicated by an (*. p<0.05) as evaluated by one-way ANOVA followed by Bonferroni's post hoc test.
Figure 7
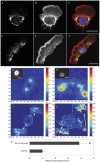
Figure 7. Changes in distribution of active myosin and traction forces after Gleevec treatment.
Control NBT-II cells (A–C) or Gleevec-treated cells (D–F) that have been fixed, permeabilized and stained for phosphorylated myosin II light chain (p-MLC) to visualize active myosin localization (A and D) and Rhodamine-phalloidin to visualize the actin cytoskeleton (B and E). (C and F) Overlay images indicate the colocalization of actin bundles and p-MLC (red). The nucleus of the cell is stained with DAPI . Bar = 20 µm. (G to J) Elastic substrate traction mapping of a control NBT-II cell (G and I) and Gleevec-treated NBT-II cell (H–J). (G and H) are the bead displacement maps and (I and J) are the traction maps where color bars indicate relative values (see Methods). The inset images in G and H are the phase image of the control cell and the Gleevec-treated cell. The white lines in G and H are outline of each cell. The inset images of figure I and J are the tractions magnified from indicated cell wings. Panel K is a calculation of the total cell traction force generated by cells (Materials and Methods). The value is normalized to total traction forces from control cells. The bar graph indicates NBTII cells treated with Gleevec generate considerably more total traction force than control NBTII cells. Error bars are standard deviation. Bar = 20 µm. 8 cells were examined for each case. Control and Gleevec-treated cells are significantly different in total cell traction force (* p<0.01, by student's t-test).
Figure 8
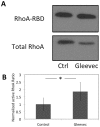
Figure 8. Abl-family kinase inhibition increases RhoA activity.
A) A RhoGTPase pull-down assay before and after Gleevec treatment (20 µM). NBT-II cells were cultured on a 10 µg/ml collagen-coated substrate. B) A bar graph quantifying the results from the pull-down assay. (n = 4 experiments). Error bars indicate standard deviations. Control and Gleevec-treated cells are significantly different in RhoA activity (* p<0.05, by student's t-test).
Figure 9
Figure 9. RhoA/ROCK activity is important for the Gleevec phenotype.
A), B) and C) are DIC images of NBT-II cell migration status in the presence of 20 uM Gleevec only, both 20 uM Gleevec and ROCK inhibitor(5 uM Y-27632), or both 20 uM Gleevec and RhoA inhibitor (C3, 1 ug/ml), respectively. These panels show that RhoA inhibition after Gleevec treatment increases the number of retraction fibers and produces more rounded nuclei. Scale bars are 20 µm. Panels D) to G) are cell migration speed, cell migration persistence, nuclear aspect ratio and cell retraction fiber ratio, respectively. In each figure, the four bars represent the control group, the 20 uM Gleevec-treated group, the 5 µM Y-27632 +20 µM Gleevec-treated group, and the 1 µg/ml C3 +20 µM Gleevec-treated group, respectively. Error bars indicate standard deviations. At least 15 cells were measured for each group. The significance of the difference between control and other treated groups was evaluated by one-way ANOVA followed by Bonferroni's post hoc test, and marked by (*), p<0.05;.

Similar articles

Cited by

References

    1. Ridley AJ, Schwartz MA, Burridge K, Firtel RA, Ginsberg MH, et al. (2003) Cell migration: integrating signals from front to back. Science 302: 1704–1709. - PubMed
    1. Webb DJ, Zhang H, Horwitz AF (2005) Cell migration: an overview. Methods Mol Biol 294: 3–11. - PubMed
    1. Franz CM, Jones GE, Ridley AJ (2002) Cell migration in development and disease. Dev Cell 2: 153–158. - PubMed
    1. Schwartzberg PL, Stall AM, Hardin JD, Bowdish KS, Humaran T, et al. (1991) Mice homozygous for the ablm1 mutation show poor viability and depletion of selected B and T cell populations. Cell 65: 1165–1175. - PubMed
    1. Li B, Boast S, de los Santos K, Schieren I, Quiroz M, et al. (2000) Mice deficient in Abl are osteoporotic and have defects in osteoblast maturation. Nat Genet 24: 304–308. - PubMed

Publication types

MeSH terms