. 2012;7(12):e52584.
doi: 10.1371/journal.pone.0052584. Epub 2012 Dec 26.

Atomic scissors: a new method of tracking the 5-bromo-2'-deoxyuridine-labeled DNA in situ

Affiliations

Atomic scissors: a new method of tracking the 5-bromo-2'-deoxyuridine-labeled DNA in situ

Anna Ligasová et al. PLoS One. 2012.

Abstract

A new method of the light microscopy detection of BrdU-labeled DNA in situ is described. It is based on the oxidative attack at the deoxyribose moiety by copper(I) in the presence of oxygen, which leads to the abstraction of hydrogen atom from deoxyribose culminating in the elimination of the nucleobase, scission of the nucleic-acid strand and formation of frequent gaps. The gaps allow the reaction of the antibodies with the commonly used markers of replication (e.g. 5-bromo-2'-deoxyuridine), which are otherwise masked. The method developed makes it possible to detect nuclear and mitochondrial DNA replication efficiently. In most cases, it does not inhibit effective protein detections and in addition enables simultaneous localization of newly-synthesized RNA. The alternative presently-used methods result in protein denaturation and/or extensive DNA cleavage followed by the DNA-bound proteins peeling off.


Conflict of interest statement

Competing Interests: The authors have declared that no competing interests exist.

Figures

Figure 1
Figure 1. The cleavage of plasmid DNA using copper(II) sulfate and sodium ascorbate in presence of oxygen.
A) The results of the cleavage of the plasmid DNA are shown. The plasmid DNA (pEXP5-NT/CALM3) was incubated in an aqueous solution of copper(II) sulfate and sodium ascorbate in the presence of oxygen for 0, 1, 5, 10, 20, 30 and 60 minutes (lines 1, 2, 3, 4, 5, 6 and 7, respectively). Line M represents the DNA molecular mass marker (GeneRuler™ DNA ladder Mix, Fermentas). The lowering of integral intensity toward 60 minutes apparently resulted from the increase of the low-weight DNA that escaped the gel. B) The centers of density of the bands from the above-mentioned experiments (a) plotted against the time of the incubation are shown.
Figure 2
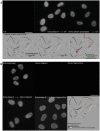
Figure 2. The gaps detection, the effect of SOD, Hepes and Tris-HCl and the abasic sites detection.
A) The detection of the gaps produced by the incubation of cells with 4 mM copper(I) for 30 minutes or by the incubation of cells in the solution of 4 mM copper(II) sulfate for 5 minutes, followed by the reduction of the DNA-bound bivalent copper ions by 10 mM sodium ascorbate for 5 minutes is shown. The gaps were visualized by means of DNA polymerase I and Alexa-dUTP. Bar: 20 µm. B) The effect of SOD on plasmid DNA cleavage is shown. The plasmid DNA was incubated in the cleavage solution for 5, 10 and 30 minutes without (lines 1, 2, 3, respectively) or with SOD (lines 4, 5, 6, respectively). Line 7 represents the copper(I) untreated sample; line M represents the DNA molecular mass marker. Only a very low inhibition of DNA cleavage by SOD was observed. C) The effect of Hepes and Tris-HCl is shown. The plasmid DNA was incubated in cleavage solution for 0, 5, 10 and 30 minutes alone (lines 1, 2, 3, 4, respectively), with 0.2 M Hepes (lines 5, 6, 7, 8, respectively) or with 0.1 M Tris-HCl (lines 9, 10, 11, 12, respectively). Line M represents the DNA molecular mass marker. Only Tris-HCl efficiently blocked DNA cleavage. D) The effect of piperidine is shown. The plasmid DNA was incubated in cleavage solution for 30 minutes and subsequently in 1 M piperidine (line 1) or distilled water (line 2) at 90°C. Line M represents the DNA molecular mass marker. The shift to the shorter DNA fragments after piperidine treatment indicates formation of abasic sites.
Figure 3
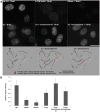
Figure 3. Copper(I) treatment produces short gaps with phosphate groups at the 3′ end.
A) TdT was used to incorporate Alexa-dUTP at the 3′ end of the gaps. A strong signal is observed only after the pre-incubation of cells with exonuclease III or SAP. The model shows the situation after the action of SAP in the case of double-stranded DNA with several gaps. Although the phosphate groups are shown also at the 5′ end of the gaps, it is not clear whether they are present there. Therefore, the action of SAP is shown for 3′ phosphate groups exclusively. Bar: 20 µm. B) DNA polymerase I, Klenow fragment and Klenow fragment Exo- were used to incorporate Alexa-dUTP at the gap sites produced by monovalent copper. Only DNA polymerase I produced a strong signal. When incubation with exonuclease III preceded the polymerase step, a strong signal was observed also in the case of both Klenow fragments. The model shows the action of DNA polymerase I at the sites of created gaps. Both 3′-5′ proofreading activity enabling hydroxyl group formation and 5′-3′ exonuclease activity (for the sake of simplicity, the excised nucleotides are not shown in the model) enabling nick translation are necessary. As no ligase activity was present, nicks at the ends of the labeled chains persisted (arrows in the model picture), although it is not apparent. Bar: 20 µm.
Figure 4
Figure 4. Copper(I)-oxygen efficiently reveals incorporated BrdU; the revelation can be further increased by means of exonucleases.
A) The results of the detection of the BrdU labeling of replicated DNA using acid (4 N HCl) or hydroxide (0.07 M NaOH) or DNase I treatment or the one-step or the two-step procedure are shown. All of the images were taken using 99-ms time to be able to compare the signal intensity. In the one-step procedure (the image labeled as Cu), the 30-minute treatment with copper(I)-oxygen was used exclusively. In the two-step protocol, a 10-minute treatment of the samples with copper(I)-oxygen was followed by incubation with exonuclease III or exonuclease λ. The model shows the situation for both one-step and two-step procedures. Note that exonuclease λ reveals BrdU-labeled parts in the proximity of close single gaps as it has no activity at nicks and limited activity at gaps. Only close single gaps can result into the formation of double-strand break. Although only one strand is usually labeled by BrdU, the situation is shown as if both strands were labeled in the schematic picture. The revealed parts of distinct strands are distinguished by colors. Bar: 20 µm. B) Relative signal intensity is shown in the graph.
Figure 5
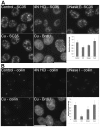
Figure 5. A comparison of the methods based on HCl, DNase I and copper(I) ions.
A) The detection of SC35 protein in non-treated cells (control; the cells were just fixed and permeabilized without any additional treatment), cells treated with 4 N HCl, DNase I or with a standard two-step procedure (Cu – SC35) is shown. All of the images have been acquired at 7 ms. A simultaneous detection of the BrdU-labeled newly replicated DNA in copper-treated cells from the Cu – SC35 image is shown in the image labeled as Cu – BrdU (the acquisition time was 99 ms). The graph shows the relative signal intensities of particular kinds of the treatments used. Bars: 20 µm. B) The detection of coilin protein in non-treated cells (control; the cells were just fixed and permeabilized without any additional treatment), cells treated with 4 N HCl, DNase I or with a standard two-step procedure (Cu – coilin) is shown. All of the images have been acquired at 4 ms. A simultaneous detection of the BrdU-labeled newly replicated DNA in copper-treated cells from the Cu – coilin image is shown in the image labeled as Cu – BrdU (the acquisition time was 99 ms). The graph shows the relative signal intensities of particular kinds of the treatments used. Bars: 20 µm.
Figure 6
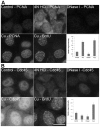
Figure 6. A comparison of the methods based on HCl, DNase I and copper(I) ions.
A) The detection of PCNA in non-treated cells (control; the cells were just fixed and permeabilized without any additional treatment), cells treated with 4 N HCl, DNase I or with a standard two-step procedure (Cu – PCNA) is shown. All of the images have been acquired at 83 ms. A simultaneous detection of the BrdU-labeled newly replicated DNA in copper-treated cells from the Cu – PCNA image is shown in the image labeled as Cu – BrdU (the acquisition time was 99 ms). The graph shows the relative signal intensities of particular kinds of the treatments used. Bars: 20 µm. B) The detection of Cdc45 protein in non-treated cells (control; the cells were just fixed and permeabilized without any additional treatment), cells treated with 4 N HCl, DNase I or with a standard two-step procedure (Cu – Cdc45) is shown. All of the images have been acquired at 170 ms. A simultaneous detection of the BrdU-labeled newly replicated DNA in copper-treated cells from the Cu – Cdc45 image is shown in the image labeled as Cu – BrdU (the acquisition time was 99 ms). The graph shows the relative signal intensities of particular kinds of the treatments used. Bars: 20 µm.
Figure 7
Figure 7. A comparison of the methods based on HCl, DNase I and copper(I) ions.
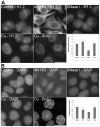
A) The detection of H1.2 protein in non-treated cells (control; the cells were just fixed and permeabilized without any additional treatment), cells treated with 4 N HCl, DNase I or with a standard two-step procedure (Cu – H1.2) is shown. All of the images have been acquired at 20 ms. A simultaneous detection of the BrdU-labeled newly replicated DNA in copper-treated cells from the Cu – H1.2 image is shown in the image labeled as Cu – BrdU (the acquisition time was 99 ms). The graph shows the relative signal intensities of particular kinds of the treatments used. Bars: 20 µm. B) The detection of DNA in non-treated cells (control; the cells were just fixed and permeabilized without any additional treatment), cells treated with 4 N HCl, DNase I or with a standard two-step procedure (Cu – DAPI) is shown. All of the images have been acquired at 9 ms. A simultaneous detection of the BrdU-labeled newly replicated DNA in copper-treated cells from the Cu – DAPI image is shown in the image labeled as Cu – BrdU (the acquisition time was 99 ms). The graph shows the relative signal intensities of particular kinds of the treatments used. Bars: 20 µm.
Figure 8
Figure 8. A comparison of the methods based on HCl, DNase I and copper(I) ions.
A) The detection of the EU signal in non-treated cells (control; the cells were just fixed and permeabilized without any additional treatment), cells treated with 4N HCl, DNase I or with a standard two-step procedure (Cu – EU) is shown. All of the images have been acquired at 17 ms. A simultaneous detection of the BrdU-labeled newly replicated DNA in copper-treated cells from the Cu – EU image is shown in the image labeled as Cu – BrdU (the acquisition time was 230 ms). The graph shows the relative signal intensities of particular kinds of the treatments used. Bars: 20 µm. B) The detection of polyadenylated RNA in non-treated cells (control; the cells were just fixed and permeabilized without any additional treatment), in cells treated with a standard two-step procedure (Cu) and in cells treated with 4 N HCl (HCl) is shown. Polyadenylated RNA was detected according to . Bar: 20 µm.
Figure 9
Figure 9. The detection of the BrdU-labeled DNA in mitochondria.
The detection of the BrdU-labeled DNA (red in the color image) after a 1- and 12-hour BrdU pulse in cells treated with 0.5 M HCl for 20 minutes (the acquisition times were 335 ms and 33 ms for the 1- and 12-hour labeling, respectively) or with 4 mM copper(I) for 60 seconds followed by exonuclease III cleavage (the acquisition times were 54 ms and 6 ms for the 1- and 12-hour labeling, respectively) is shown. A simultaneous colocalization with the mitochondrial marker MTC02 has been performed for both methods (green in the color image). In this case, the acquisition times were: 260 ms for the copper(I) cleavage and 960 ms for the HCl treatment. The localization of the mitochondrial marker MTC02 in the copper(I) or HCl non-treated cells is shown in the image labeled as control (the acquisition time was 200 ms). Bar: 10 µm.

Similar articles

Cited by

References

    1. Ageno M, Dore E, Frontali C (1969) The alkaline denaturation of DNA. Biophys J 9: 1281–1311. - PMC - PubMed
    1. Dimitrova DS, Berezney R (2002) The spatio-temporal organization of DNA replication sites is identical in primary, immortalized and transformed mammalian cells. J Cell Sci 115: 4037–4051. - PubMed
    1. Jackson DA, Pombo A (1998) Replicon clusters are stable units of chromosome structure: evidence that nuclear organization contributes to the efficient activation and propagation of S phase in human cells. J Cell Biol 140: 1285–1295. - PMC - PubMed
    1. Kennedy BK, Barbie DA, Classon M, Dyson N, Harlow E (2000) Nuclear organization of DNA replication in primary mammalian cells. Genes Dev 14: 2855–2868. - PMC - PubMed
    1. Stanojcic S, Lemaitre JM, Brodolin K, Danis E, Mechali M (2008) In Xenopus egg extracts, DNA replication initiates preferentially at or near asymmetric AT sequences. Mol Cell Biol 28: 5265–5274. - PMC - PubMed

Publication types

Grants and funding

This work has been supported by the Czech Science Foundation [204/09/0973, P302/12/G157] and the Grant Agency of the Academy of Sciences of the Czech Republic [KAN 200520801, AV0Z50520514 and AV0Z50040702]. The funders had no role in study design, data collection and analysis, decision to publish, or preparation of the manuscript.