Establishment, characterization and chemosensitivity of three mismatch repair deficient cell lines from sporadic and inherited colorectal carcinomas
- PMID: 23300683
- PMCID: PMC3534085
- DOI: 10.1371/journal.pone.0052485
Establishment, characterization and chemosensitivity of three mismatch repair deficient cell lines from sporadic and inherited colorectal carcinomas
Abstract
Background: Colorectal cancer (CRC) represents a morphologic and molecular heterogenic disease. This heterogeneity substantially impairs drug effectiveness and prognosis. The subtype of mismatch repair deficient (MMR-D) CRCs, accounting for about 15% of all cases, shows particular differential responses up to resistance towards currently approved cytostatic drugs. Pre-clinical in vitro models representing molecular features of MMR-D tumors are thus mandatory for identifying biomarkers that finally help to predict responses towards new cytostatic drugs. Here, we describe the successful establishment and characterization of three patient-derived MMR-D cell lines (HROC24, HROC87, and HROC113) along with their corresponding xenografts.
Methodology: MMR-D cell lines (HROC24, HROC87, and HROC113) were established from a total of ten clinicopathological well-defined MMR-D cases (120 CRC cases in total). Cells were comprehensively characterized by phenotype, morphology, growth kinetics, invasiveness, and molecular profile. Additionally, response to clinically relevant chemotherapeutics was examined in vitro and in vivo.
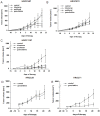
Principal findings: Two MMR-D lines showing CIMP-H derived from sporadic CRC (HROC24: K-ras(wt), B-raf(mut), HROC87: K-ras(wt), B-raf(mut)), whereas the HROC113 cell line (K-ras(mut), B-raf(wt)) was HNPCC-associated. A diploid DNA-status could be verified by flow cytometry and SNP Array analysis. All cell lines were characterized as epithelial (EpCAM(+)) tumor cells, showing surface tumor marker expression (CEACAM(+)). MHC-class II was inducible by Interferon-γ stimulation. Growth kinetics as well as invasive potential was quite heterogeneous between individual lines. Besides, MMR-D cell lines exhibited distinct responsiveness towards chemotherapeutics, even when comparing in vitro and in vivo sensitivity.
Conclusions: These newly established and well-characterized, low-passage MMR-D cell lines provide a useful tool for future investigations on the biological characteristics of MMR-D CRCs, both of sporadic and hereditary origin. Additionally, matched patient-derived immune cells allow for comparative genetic studies.
Conflict of interest statement
Figures


Similar articles
-
Establishment, functional and genetic characterization of three novel patient-derived rectal cancer cell lines.World J Gastroenterol. 2018 Nov 21;24(43):4880-4892. doi: 10.3748/wjg.v24.i43.4880. World J Gastroenterol. 2018. PMID: 30487698 Free PMC article.
-
Establishment and characterization of cell lines from chromosomal instable colorectal cancer.World J Gastroenterol. 2015 Jan 7;21(1):164-76. doi: 10.3748/wjg.v21.i1.164. World J Gastroenterol. 2015. PMID: 25574089 Free PMC article.
-
Functional Characterization and Drug Response of Freshly Established Patient-Derived Tumor Models with CpG Island Methylator Phenotype.PLoS One. 2015 Nov 30;10(11):e0143194. doi: 10.1371/journal.pone.0143194. eCollection 2015. PLoS One. 2015. PMID: 26618628 Free PMC article.
-
Mismatch repair deficient colorectal cancer in the era of personalized treatment.Nat Rev Clin Oncol. 2010 Apr;7(4):197-208. doi: 10.1038/nrclinonc.2010.18. Epub 2010 Feb 23. Nat Rev Clin Oncol. 2010. PMID: 20177404 Review.
-
Lynch syndrome and Lynch syndrome mimics: The growing complex landscape of hereditary colon cancer.World J Gastroenterol. 2015 Aug 21;21(31):9253-61. doi: 10.3748/wjg.v21.i31.9253. World J Gastroenterol. 2015. PMID: 26309352 Free PMC article. Review.
Cited by
-
Patient-Derived Xenografts and Matched Cell Lines Identify Pharmacogenomic Vulnerabilities in Colorectal Cancer.Clin Cancer Res. 2019 Oct 15;25(20):6243-6259. doi: 10.1158/1078-0432.CCR-18-3440. Epub 2019 Aug 2. Clin Cancer Res. 2019. PMID: 31375513 Free PMC article.
-
Establishment, functional and genetic characterization of three novel patient-derived rectal cancer cell lines.World J Gastroenterol. 2018 Nov 21;24(43):4880-4892. doi: 10.3748/wjg.v24.i43.4880. World J Gastroenterol. 2018. PMID: 30487698 Free PMC article.
-
Establishment, functional and genetic characterization of a colon derived large cell neuroendocrine carcinoma cell line.World J Gastroenterol. 2018 Sep 7;24(33):3749-3759. doi: 10.3748/wjg.v24.i33.3749. World J Gastroenterol. 2018. PMID: 30197480 Free PMC article.
-
Establishment and characterization of cell lines from chromosomal instable colorectal cancer.World J Gastroenterol. 2015 Jan 7;21(1):164-76. doi: 10.3748/wjg.v21.i1.164. World J Gastroenterol. 2015. PMID: 25574089 Free PMC article.
-
E7080 (lenvatinib), a multi-targeted tyrosine kinase inhibitor, demonstrates antitumor activities against colorectal cancer xenografts.Neoplasia. 2014 Nov 20;16(11):972-81. doi: 10.1016/j.neo.2014.09.008. eCollection 2014 Nov. Neoplasia. 2014. PMID: 25425971 Free PMC article.
References
-
- Hewitt RE, McMarlin A, Kleiner D, Wersto R, Martin P, et al. (2000) Validation of a model of colon cancer progression. J Pathol 192: 446–454. - PubMed
-
- Voskoglou-Nomikos T, Pater JL, Seymour L (2003) Clinical predictive value of the in vitro cell line, human xenograft, and mouse allograft preclinical cancer models. Clin Cancer Res 9: 4227–4239. Review. - PubMed
-
- Ostwald C, Linnebacher M, Weirich V, Prall F (2009) Chromosomally and microsatellite stable colorectal carcinomas without the CpG island methylator phenotype in a molecular classification. Int J Oncol 35: 321–327. - PubMed
-
- Harrison S, Benziger H (2011) The molecular biology of colorectal carcinoma and its implications: a review. Surgeon 9: 200–210. Review. - PubMed
Publication types
MeSH terms
Substances
Grants and funding
LinkOut - more resources
Full Text Sources
Medical
Research Materials
Miscellaneous

