. 2013 Feb;123(2):844-54.
doi: 10.1172/JCI65260. Epub 2013 Jan 9.

Specialized role of migratory dendritic cells in peripheral tolerance induction

Affiliations

Specialized role of migratory dendritic cells in peripheral tolerance induction

Juliana Idoyaga et al. J Clin Invest. 2013 Feb.

Abstract

Harnessing DCs for immunotherapies in vivo requires the elucidation of the physiological role of distinct DC populations. Migratory DCs traffic from peripheral tissues to draining lymph nodes charged with tissue self antigens. We hypothesized that these DC populations have a specialized role in the maintenance of peripheral tolerance, specifically, to generate suppressive Foxp3+ Tregs. To examine the differential capacity of migratory DCs versus blood-derived lymphoid-resident DCs for Treg generation in vivo, we targeted a self antigen, myelin oligodendrocyte glycoprotein, using antibodies against cell surface receptors differentially expressed in these DC populations. Using this approach together with mouse models that lack specific DC populations, we found that migratory DCs have a superior ability to generate Tregs in vivo, which in turn drastically improve the outcome of experimental autoimmune encephalomyelitis. These results provide a rationale for the development of novel therapies targeting migratory DCs for the treatment of autoimmune diseases.


Figures

Figure 1
Figure 1. α-DEC and α-Langerin, but not α-DCIR2 and α-Treml4 mAbs, target skin migratory DCs in vivo.
(A) Gating strategy for DC subsets in sLN (see also Supplemental Figure 1). Live lineage cells (CD19Ter119DX5CD3ε) were examined for CD11c and MHC II (center panel). CD11chiMHC IIint DCs were stained for the expression of CD8 to identify CD8+ (i) and CD8 (ii) DC subsets (left panel). ~25% of CD8+ DCs in B6 mice expressed Langerin (overlaid red dot plot). CD11cint/hi MHC IIhi migratory DCs were further gated into CD11bhi DCs (iii), CD11b DCs (iv), Langerin+CD103+ DCs (v), and Langerin+ CD103 LCs (vi). (B) Microarray analysis of Ly75 (DEC), Clec4a4 (DCIR2), Cd207 (Langerin), and Treml4 by distinct migratory and lymphoid-resident DC subsets sorted from spleen or sLN. Lymphoid-resident DCs were sorted based on CD8 and CD4 expression. Heat map depicts normalized values averaged from 3 replicates. Red and blue represent high and low relative expression, respectively. (C) Protein expression of DEC, DCIR2, and Treml4 by distinct DC subsets analyzed by FACS. (D) Langerin-EGFP mice were inoculated s.c. via footpad with 10 μg Alexa Fluor 647–labeled α-receptor mAbs or control Ig mAb (GL117, gray histograms). Uptake of labeled mAb by distinct DC populations in the spleen and sLN was evaluated 18–24 hours later by FACS. One experiment representative of 2–3 is shown.
Figure 2
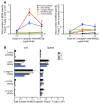
Figure 2. Targeting MOGp to DEC+ and Langerin+ DCs expands and induces de novo Foxp3+ T cells in vivo.
(A) Experimental design (left) to assess the proliferation of MOG-specific CD4+ T cell in sLN 4 days after s.c. inoculation of α-receptor–MOGp mAbs. Histograms (right) are gated on MOG-specific donor T cells (Vβ11+, CD45.1+), and are representative of 2–3 experiments. (B) De novo induction of Foxp3+ T cells by α-receptor–MOGp mAbs. 4 × 10⁶ naive CD4+ T cells (CD25, Foxp3-EGFP, CD44lo, CD45RBhi) FACS sorted from MOG-specific Foxp3-EGFP reporter mice (see Supplemental Figure 3A for sorting strategy) were transferred 1 day before the inoculation of 3 μg α-receptor–MOGp mAbs s.c. footpad. Seven days later, the frequency (left) and total number (right) of induced MOG-specific Foxp3-EGFP+ T cells were analyzed in the sLN or spleen. Bars are the mean ± SEM of 4–8 mice in 2–4 experiments. (C) Expansion of nTregs by α-receptor–MOGp mAbs. Recipient mice were co-transferred with 1 × 10⁶ Violet-labeled MOG-specific CD45.1 Foxp3-EGFP+ nTregs and 4 × 10⁶ MOG-specific CD45.2 naive T cells (left panels show sorting strategy) 1 day before inoculation of 3 μg α-receptor–MOGp mAbs s.c. via footpad. Histograms (right) show the proliferation of Violet-labeled MOG-specific Foxp3+ nTregs in spleen and sLN and are representative of 2 experiments.
Figure 3
Figure 3. Antigen delivery with α-DEC and α-Langerin mAbs is more efficient than α-DCIR2 and α-Treml4 for the generation of MOG-specific Foxp3+ T cells.
(A) Dose response of MOG-specific Foxp3+ T cell generation in sLN (left) and spleen (right). Recipient mice transferred with 4 × 10⁶ MOG-specific CD4+ T cells 1 day before s.c. inoculation of α-receptor–MOGp mAbs were analyzed 7 days later. Mean ± SEM of 3–5 experiments, with a total of 6–10 mice per group. (B) As in A, but comparison of different inoculation routes: s.c. via footpad, i.p., i.v., and i.m. Mean ± SEM of 4–8 mice per group in 2–4 experiments.
Figure 4
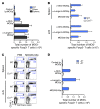
Figure 4. Skin Langerin+ migratory DCs mediate Foxp3+ T cell generation after α-DEC and α-Langerin targeting.
(A) Generation of MOG-specific Foxp3+ T cells in sLN of B6 WT, sham, or splenectomized (Splenec) mice. Mice receiving transfer of 4 × 10⁶ MOG-specific CD4+ T cells 1 day before s.c. inoculation of 3 μg α-Langerin– or α-DEC–MOGp were analyzed 7 days later. Mean ± SEM of 2 experiments with 4 mice per group. (B) As in A, but comparing MOG-specific Foxp3+ T cell generation in sLN and spleen of B6 WT and Ccr7–/– mice. Mice inoculated with untargeted MOG35-55p received 300 μg. Mean ± SEM of 4–8 mice in 2–4 experiments. (C) Four-day proliferation of Violet-labeled MOG-specific CD45.1+CD4+ T cells (4 × 10⁶) transferred into CD45.2 WT or Ccr7–/– recipient mice 1 day before s.c. inoculation of untargeted MOG35-55p (300 μg). Gates represent the percentage of donor CD45.1+ T cells undergoing one or more divisions. Plots are gated on CD3ε+CD4+ T cells and are representative of 2 experiments. (D) Generation of MOG-specific Foxp3+ T cells in sLN of mice depleted of Langerin+ cells. As in B, but Langerin-DTR mice were treated with or without 500 ng DT i.v. the day of T cell transfer (day –1), followed by 250 ng DT i.p. on days 1, 3, and 5. Mean ± SEM of 4–6 mice per group in 2–3 experiments.
Figure 5
Figure 5. LCs and dermal CD103+ migratory DCs are able to generate MOG-specific Foxp3+ T cells.
(A) Lethally irradiated DEC-deficient mice (Ly75–/–; CD45.2) and WT (CD45.1) mice were injected with bone marrow cells from WT (CD45.1) or DEC-deficient (Ly75–/–; CD45.2) mice, respectively, and reconstituted for 12 weeks. The expression of DEC in radiosensitive CD103+ DCs and radioresistant LCs was evaluated by FACS using the congenic markers CD45.1 and CD45.2 (gating strategy as in Supplemental Figure 1A). Ly75–/– and WT mice were used as controls. (B) Frequency (left) and total number (right) of Foxp3+ T cells in sLN and spleen from chimeric mice 7 days after s.c. inoculation with 3 μg α-DEC–MOGp mAb, given 1 day after transfer of 4 × 10⁶ MOG-specific CD4+ T cells. Mean ± SEM of 4–12 mice in 2–4 experiments.
Figure 6
Figure 6. Lung CD103+ migratory DCs generate MOG-specific Foxp3+ T cells after i.n. inoculation of α-DEC–, α-Langerin–, and α-Treml4–MOGp mAbs.
(A) Foxp3 expression in MOG-specific T cells from mediastinal LN of CD45.2 B6 recipient mice 7 days after i.n. inoculation of 1 μg α-receptor–MOGp mAbs, given 1 day after transfer of 4 × 10⁶ MOG-specific CD45.1+ T cells. (B) As in A: Percentage of Foxp3+ T cells from CD45.1 transferred cells (left) or from total CD4+ T cells (right) within lung, mediastinal LN (medLN), mesenteric LN (mesLN), spleen, and sLN. Mean ± SEM of 3 experiments with 6 mice per group. (C) Microarray analysis of Ly75 (DEC), Clec4a4 (DCIR2), Cd207 (Langerin), and Treml4 by distinct lung DCs). Heat map depicts normalized values averaged from 3 replicates. Red and blue represent high and low relative expression, respectively. (D) Histograms show protein levels of DEC, Langerin, DCIR2, and Treml4 in CD103+ and CD11b+ DCs as evaluated by FACS. GL117 control mAb (gray histograms). One experiment of 2 is shown.
Figure 7
Figure 7. α-Langerin– and α-DEC–generated Foxp3+ T cells are functional Tregs that prevent the development and progression of EAE.
(A) One day after transfer of 4 × 10⁶ MOG-specific CD4+ T cells (day –15), B6 mice were inoculated s.c. with 3 μg α-receptor mAbs (day –14). EAE was induced on day 0, and disease was monitored for 40 days. Mean clinical score ± SEM is plotted over time (10–20 mice in 2–4 experiments). α-DEC and α-Langerin mAbs were statistically significant (2-way ANOVA and Bonferroni’s post hoc testing) from control Ig, α-DCIR2, and α-Treml4 mAbs (starting on day 17, *P < 0.05). Further information can be found in Supplemental Table 1. (B) Recipient B6 mice transferred with 8 × 10⁶ MOG-specific Foxp3-DTR CD4+ T cells (day –15) 1 day before s.c. inoculation of 3 μg α-Langerin–MOGp (day –14) were inoculated i.v. (day –2) and i.p. (day 1) with 250 ng DT. FACS plots (representative of 3 experiments) show depletion of MOG-specific Foxp3+ T cells in sLN 1 day after the last DT inoculation. (C) As in B, but on day 0 mice were challenged for EAE induction. Data are shown as the mean clinical score ± SEM of 15–20 mice per group in 3–4 experiments. The α-Langerin–MOGp –DT group was statistically significant (2-way ANOVA and Bonferroni’s post hoc testing) from the α-Langerin–MOGp +DT and the control Ig-MOGp groups (starting on day 21, *P < 0.05).

Similar articles

Cited by

References

    1. Wing K, Sakaguchi S. Regulatory T cells exert checks and balances on self tolerance and autoimmunity. Nat Immunol. 2010;11(1):7–13. doi: 10.1038/ni.1818. - DOI - PubMed
    1. Mucida D, Kutchukhidze N, Erazo A, Russo M, Lafaille JJ, Curotto de Lafaille MA. Oral tolerance in the absence of naturally occurring Tregs. J Clin Invest. 2005;115(7):1923–1933. doi: 10.1172/JCI24487. - DOI - PMC - PubMed
    1. Belkaid Y, Oldenhove G. Tuning microenvironments: induction of regulatory T cells by dendritic cells. Immunity. 2008;29(3):362–371. doi: 10.1016/j.immuni.2008.08.005. - DOI - PMC - PubMed
    1. Liu K, et al. In vivo analysis of dendritic cell development and homeostasis. Science. 2009;324(5925):392–397. - PMC - PubMed
    1. Liu K, Nussenzweig MC. Development and homeostasis of dendritic cells. Eur J Immunol. 2010;40(8):2099–2102. doi: 10.1002/eji.201040501. - DOI - PubMed

Publication types

MeSH terms