Vκ gene repertoire and locus contraction are specified by critical DNase I hypersensitive sites within the Vκ-Jκ intervening region
- PMID: 23296705
- PMCID: PMC3563863
- DOI: 10.4049/jimmunol.1203127
Vκ gene repertoire and locus contraction are specified by critical DNase I hypersensitive sites within the Vκ-Jκ intervening region
Abstract
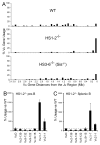
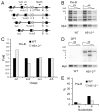
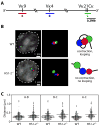
The processes of Ig gene locus contraction and looping during V(D)J-recombination are essential for creating a diverse Ab repertoire. However, no cis-acting sequence that plays a major role in specifying locus contraction has been uncovered within the Igκ gene locus. In this article, we demonstrate that a 650-bp sequence corresponding to DNase I hypersensitive sites HS1-2 within the mouse Igκ gene V-J intervening region binds CCCTC-binding factor and specifies locus contraction and long-range Vκ gene usage spanning 3.2 Mb in pre-B cells. We call this novel element Cer (for "contracting element for recombination"). Targeted deletion of Cer caused markedly increased proximal and greatly diminished upstream Vκ gene usage, higher allele usage, more splenic Igκ(+) B cells, and nonlineage-specific Igκ rearrangement in T cells. Relative to wild-type mice, Cer-deletion mice exhibited similar levels of Vκ gene germline transcription and H3K4me3 epigenetic marks but displayed a dramatic decrease in locus contraction in pre-B cells. Thus, our studies demonstrate that DNase I hypersensitive sites HS1-2 within the Vκ-Jκ intervening region are essential for controlling locus contraction and creating a diverse Ab repertoire.
Figures


Similar articles
-
A major deletion in the Vκ-Jκ intervening region results in hyperelevated transcription of proximal Vκ genes and a severely restricted repertoire.J Immunol. 2014 Oct 1;193(7):3746-54. doi: 10.4049/jimmunol.1401574. Epub 2014 Sep 3. J Immunol. 2014. PMID: 25187654 Free PMC article.
-
Cutting Edge: Proper Orientation of CTCF Sites in Cer Is Required for Normal Jκ-Distal and Jκ-Proximal Vκ Gene Usage.J Immunol. 2018 Sep 15;201(6):1633-1638. doi: 10.4049/jimmunol.1800785. Epub 2018 Aug 3. J Immunol. 2018. PMID: 30076197 Free PMC article.
-
Molecular basis for differential Igk versus Igh V(D)J joining mechanisms.Nature. 2024 Jun;630(8015):189-197. doi: 10.1038/s41586-024-07477-y. Epub 2024 May 29. Nature. 2024. PMID: 38811728 Free PMC article.
-
Dynamic Control of Long-Range Genomic Interactions at the Immunoglobulin κ Light-Chain Locus.Adv Immunol. 2015;128:183-271. doi: 10.1016/bs.ai.2015.07.004. Epub 2015 Aug 14. Adv Immunol. 2015. PMID: 26477368 Review.
-
Transcription factories in Igκ allelic choice and diversity.Adv Immunol. 2019;141:33-49. doi: 10.1016/bs.ai.2018.11.001. Epub 2018 Dec 19. Adv Immunol. 2019. PMID: 30904132 Free PMC article. Review.
Cited by
-
Chromatin architecture, CCCTC-binding factor, and V(D)J recombination: managing long-distance relationships at antigen receptor loci.J Immunol. 2013 May 15;190(10):4915-21. doi: 10.4049/jimmunol.1300218. J Immunol. 2013. PMID: 23645930 Free PMC article. Review.
-
V(D)J Recombination: Recent Insights in Formation of the Recombinase Complex and Recruitment of DNA Repair Machinery.Front Cell Dev Biol. 2022 Apr 29;10:886718. doi: 10.3389/fcell.2022.886718. eCollection 2022. Front Cell Dev Biol. 2022. PMID: 35573672 Free PMC article. Review.
-
Long-Range Regulation of V(D)J Recombination.Adv Immunol. 2015;128:123-82. doi: 10.1016/bs.ai.2015.07.003. Epub 2015 Aug 20. Adv Immunol. 2015. PMID: 26477367 Free PMC article. Review.
-
Lineage-specific 3D genome organization is assembled at multiple scales by IKAROS.Cell. 2023 Nov 22;186(24):5269-5289.e22. doi: 10.1016/j.cell.2023.10.023. Cell. 2023. PMID: 37995656 Free PMC article.
-
CTCF and ncRNA Regulate the Three-Dimensional Structure of Antigen Receptor Loci to Facilitate V(D)J Recombination.Front Immunol. 2014 Feb 11;5:49. doi: 10.3389/fimmu.2014.00049. eCollection 2014. Front Immunol. 2014. PMID: 24575097 Free PMC article. Review.
References
-
- Schatz DG, Ji Y. Recombination centres and the orchestration of V(D)J recombination. Nat Rev Immunol. 2011;11:251–263. - PubMed
-
- Casellas R, Shih TAY, Kleinewietfeld M, Jankovic M, Nemazee D, Rajewsky K, Nussenzweig MC. Contribution of receptor editing to the antibody repertoire. Science. 2001;291:1541–1544. - PubMed
-
- Longerich S, Basu U, Alt F, Storb U. AID in somatic hypermutation and class switch recombination. Curr Opin Immunol. 2006;18:164–174. - PubMed
-
- Casellas R, Jankovic M, Meyer G, Gazumyan A, Luo Y, Roeder RG, Nussenzweig MC. OcaB is required for normal transcription and V(D)J recombination in a subset of immunoglobulin κ genes. Cell. 2002;110:575–585. - PubMed
-
- Chemin G, Tinguely A, Sirac C, Lechouane F, Duchez S, Cogné M, Delpy L. Multiple RNA surveillance mechanisms cooperate to reduce the amount of nonfunctional Igκ transcripts. J Immunol. 2010;184:5009–5017. - PubMed
Publication types
MeSH terms
Substances
Grants and funding
LinkOut - more resources
Full Text Sources
Other Literature Sources
Molecular Biology Databases
Research Materials
Miscellaneous

