Down-regulation of gephyrin and GABAA receptor subunits during epileptogenesis in the CA1 region of hippocampus
- PMID: 23294024
- PMCID: PMC3618570
- DOI: 10.1111/epi.12063
Down-regulation of gephyrin and GABAA receptor subunits during epileptogenesis in the CA1 region of hippocampus
Abstract
Purpose: Epileptogenesis is the process by which a brain becomes hyperexcitable and capable of generating recurrent spontaneous seizures. In humans, it has been hypothesized that following a brain insult there are a number of molecular and cellular changes that underlie the development of spontaneous seizures. Studies in animal models have shown that an injured brain may develop epileptiform activity before appearance of epileptic seizures and that the pathophysiology accompanying spontaneous seizures is associated with a dysfunction of γ-aminobutyric acid (GABA)ergic neurotransmission. Here, we analyzed the effects of status epilepticus on the expression of GABAA receptors (GABAA Rs) and scaffolding proteins involved in the regulation of GABAA R trafficking and anchoring.
Methods: Western blot analysis was used to determine the levels of proteins involved in GABAA R trafficking and anchoring in adult rats subjected to pilocarpine-induced status epilepticus (SE) and controls. Cell surface biotinylation using a cell membrane-impermeable reagent was used to assay for changes in the expression of receptors at the plasma membrane. Finally, immunoprecipitation experiments were used to evaluate the composition of GABAA Rs. We examined for a correlation between total GABAA R subunit expression, plasma membrane expression, and receptor composition.
Key findings: Analysis of tissue samples from the CA1 region of hippocampus show that SE promotes a loss of GABAA R subunits and of the scaffolding proteins associated with them. We also found a decrease in the levels of receptors located at the plasma membrane and alterations in GABAA R composition.
Significance: The changes in protein expression of GABAA Rs and scaffolding proteins detected in these studies provide a potential mechanism to explain the deficits in GABAergic neurotransmission observed during the epileptogenic period. Our current observations represent an additional step toward the elucidation of the molecular mechanisms underlying GABAA R dysfunction during epileptogenesis.
Wiley Periodicals, Inc. © 2013 International League Against Epilepsy.
Conflict of interest statement
None of the authors has any conflict of interest to disclose. The authors have read the Journal’s position on issues involved in ethical publication and affirm that this report is consistent with those guidelines.
Figures


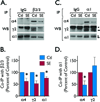
 ) Points to the immunoreactivity of α4, γ2 or α1 subunits associated with β2/3 or α1 subunits.
Similar articles
-
Calpain-dependent cleavage of GABAergic proteins during epileptogenesis.Epilepsy Res. 2019 Nov;157:106206. doi: 10.1016/j.eplepsyres.2019.106206. Epub 2019 Sep 17. Epilepsy Res. 2019. PMID: 31585309 Free PMC article.
-
Changes in the expression of GABAA receptor subunit mRNAs in parahippocampal areas after kainic acid induced seizures.Front Neural Circuits. 2013 Sep 18;7:142. doi: 10.3389/fncir.2013.00142. eCollection 2013. Front Neural Circuits. 2013. PMID: 24065890 Free PMC article.
-
Phosphatase inhibition prevents the activity-dependent trafficking of GABAA receptors during status epilepticus in the young animal.Epilepsia. 2015 Sep;56(9):1355-65. doi: 10.1111/epi.13098. Epub 2015 Aug 6. Epilepsia. 2015. PMID: 26248944
-
Antisense studies of brain GABAA receptors.Dan Med Bull. 2002 May;49(2):130-44. Dan Med Bull. 2002. PMID: 12064090 Review.
-
[GABA(A) receptor trafficking and epilepsy].Nihon Rinsho. 2014 May;72(5):790-5. Nihon Rinsho. 2014. PMID: 24912277 Review. Japanese.
Cited by
-
Long-term seizure suppression and optogenetic analyses of synaptic connectivity in epileptic mice with hippocampal grafts of GABAergic interneurons.J Neurosci. 2014 Oct 1;34(40):13492-504. doi: 10.1523/JNEUROSCI.0005-14.2014. J Neurosci. 2014. PMID: 25274826 Free PMC article.
-
The possible role of GABAA receptors and gephyrin in epileptogenesis.Front Cell Neurosci. 2013 Jul 22;7:113. doi: 10.3389/fncel.2013.00113. eCollection 2013. Front Cell Neurosci. 2013. PMID: 23885234 Free PMC article.
-
Alterations in GABAA-Receptor Trafficking and Synaptic Dysfunction in Brain Disorders.Front Cell Neurosci. 2019 Mar 7;13:77. doi: 10.3389/fncel.2019.00077. eCollection 2019. Front Cell Neurosci. 2019. PMID: 30899215 Free PMC article.
-
Gephyrin Cleavage in In Vitro Brain Ischemia Decreases GABAA Receptor Clustering and Contributes to Neuronal Death.Mol Neurobiol. 2016 Aug;53(6):3513-3527. doi: 10.1007/s12035-015-9283-2. Epub 2015 Jun 21. Mol Neurobiol. 2016. PMID: 26093381
-
Seizure-related regulation of GABAA receptors in spontaneously epileptic rats.Neurobiol Dis. 2015 May;77:246-56. doi: 10.1016/j.nbd.2015.03.001. Epub 2015 Mar 11. Neurobiol Dis. 2015. PMID: 25769812 Free PMC article.
References
-
- Brooks-Kayal AR, Shumate MD, Jin H, Rikhter TY, Coulter DA. Selective changes in single cell GABA(A) receptor subunit expression and function in temporal lobe epilepsy. Nat Med. 1998;4:1166–1172. - PubMed
-
- Charych EI, Yu W, Miralles CP, Serwanski DR, Li X, Rubio M, De Blas AL. The brefeldin A-inhibited GDP/GTP exchange factor 2, a protein involved in vesicular trafficking, interacts with the beta subunits of the GABA receptors. J Neurochem. 2004;90:173–189. - PubMed
-
- Chen JW, Naylor DE, Wasterlain CG. Advances in the pathophysiology of status epilepticus. Acta Neurol Scand Suppl. 2007;186:7–15. - PubMed
-
- Chen ZW, Olsen RW. GABAA receptor associated proteins: a key factor regulating GABAA receptor function. J Neurochem. 2007;100:279–294. - PubMed
Publication types
MeSH terms
Substances
Grants and funding
LinkOut - more resources
Full Text Sources
Other Literature Sources
Medical
Miscellaneous

