

Pathway correlation profile of gene-gene co-expression for identifying pathway perturbation
- PMID: 23284898
- PMCID: PMC3527387
- DOI: 10.1371/journal.pone.0052127
Pathway correlation profile of gene-gene co-expression for identifying pathway perturbation
Abstract
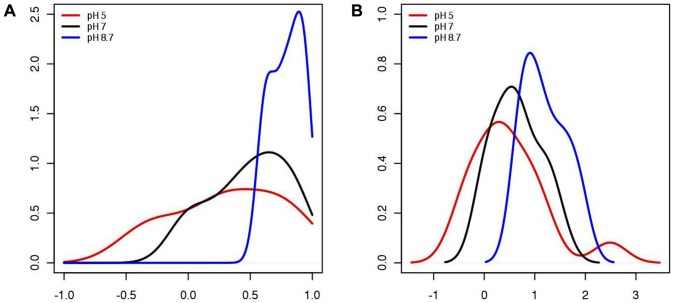
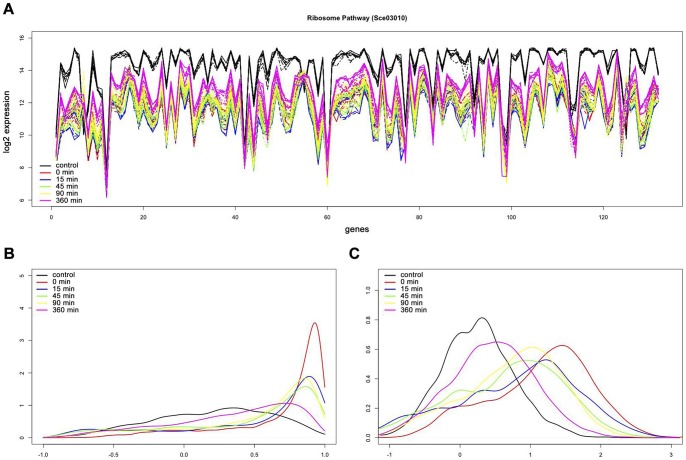
Identifying perturbed or dysregulated pathways is critical to understanding the biological processes that change within an experiment. Previous methods identified important pathways that are significantly enriched among differentially expressed genes; however, these methods cannot account for small, coordinated changes in gene expression that amass across a whole pathway. In order to overcome this limitation, we use microarray gene expression data to identify pathway perturbation based on pathway correlation profiles. By identifying the distribution of gene-gene pair correlations within a pathway, we can rank the pathways based on the level of perturbation and dysregulation. We have shown this successfully for differences between two experimental conditions in Escherichia coli and changes within time series data in Saccharomyces cerevisiae, as well as two estrogen receptor response classes of breast cancer. Overall, our method made significant predictions as to the pathway perturbations that are involved in the experimental conditions.
Conflict of interest statement
Figures


Similar articles
-
A novel method of using Deep Belief Networks and genetic perturbation data to search for yeast signaling pathways.PLoS One. 2018 Sep 12;13(9):e0203871. doi: 10.1371/journal.pone.0203871. eCollection 2018. PLoS One. 2018. PMID: 30208101 Free PMC article.
-
Biological and functional analysis of statistically significant pathways deregulated in colon cancer by using gene expression profiles.Int J Biol Sci. 2008;4(6):368-78. doi: 10.7150/ijbs.4.368. Epub 2008 Oct 14. Int J Biol Sci. 2008. PMID: 18953405 Free PMC article.
-
Regulation of ribosome biosynthesis in Escherichia coli and Saccharomyces cerevisiae: diversity and common principles.J Bacteriol. 1999 Nov;181(22):6857-64. doi: 10.1128/JB.181.22.6857-6864.1999. J Bacteriol. 1999. PMID: 10559149 Free PMC article. Review. No abstract available.
-
Origin of co-expression patterns in E. coli and S. cerevisiae emerging from reverse engineering algorithms.PLoS One. 2008 Aug 20;3(8):e2981. doi: 10.1371/journal.pone.0002981. PLoS One. 2008. PMID: 18714358 Free PMC article.
-
Does selective gene activation direct evolution?FEBS Lett. 1997 Jan 27;402(1):4-8. doi: 10.1016/s0014-5793(96)01479-2. FEBS Lett. 1997. PMID: 9013846 Review.
Cited by
-
MinePath: Mining for Phenotype Differential Sub-paths in Molecular Pathways.PLoS Comput Biol. 2016 Nov 10;12(11):e1005187. doi: 10.1371/journal.pcbi.1005187. eCollection 2016 Nov. PLoS Comput Biol. 2016. PMID: 27832067 Free PMC article.
-
Novel structural co-expression analysis linking the NPM1-associated ribosomal biogenesis network to chronic myelogenous leukemia.Sci Rep. 2015 Jul 24;5:10973. doi: 10.1038/srep10973. Sci Rep. 2015. PMID: 26205693 Free PMC article.
-
Machine Learning analysis of high-grade serous ovarian cancer proteomic dataset reveals novel candidate biomarkers.Sci Rep. 2022 Feb 23;12(1):3041. doi: 10.1038/s41598-022-06788-2. Sci Rep. 2022. PMID: 35197484 Free PMC article.
-
Aurora-A signaling is activated in advanced stage of squamous cell carcinoma of head and neck cancer and requires osteopontin to stimulate invasive behavior.Oncotarget. 2014 Apr 30;5(8):2243-62. doi: 10.18632/oncotarget.1896. Oncotarget. 2014. PMID: 24810160 Free PMC article.
-
Metabolite-Centric Reporter Pathway and Tripartite Network Analysis of Arabidopsis Under Cold Stress.Front Bioeng Biotechnol. 2018 Sep 11;6:121. doi: 10.3389/fbioe.2018.00121. eCollection 2018. Front Bioeng Biotechnol. 2018. PMID: 30258841 Free PMC article.
References
-
- Huang da W, Sherman BT, Lempicki RA (2009) Systematic and integrative analysis of large gene lists using DAVID bioinformatics resources. Nature protocols 4: 44–57. - PubMed
Publication types
MeSH terms
Grants and funding
LinkOut - more resources
Full Text Sources
Molecular Biology Databases
