

Autofluorescence imaging of living pancreatic islets reveals fibroblast growth factor-21 (FGF21)-induced metabolism
- PMID: 23283237
- PMCID: PMC3514516
- DOI: 10.1016/j.bpj.2012.10.028
Autofluorescence imaging of living pancreatic islets reveals fibroblast growth factor-21 (FGF21)-induced metabolism
Abstract
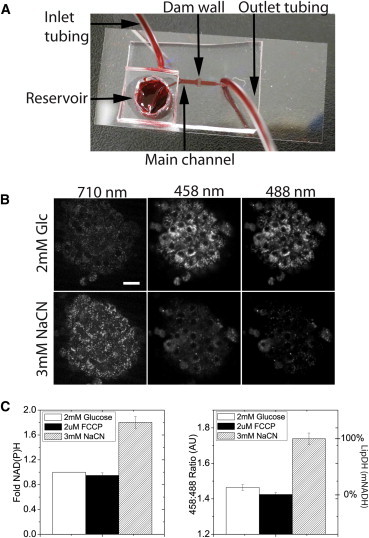
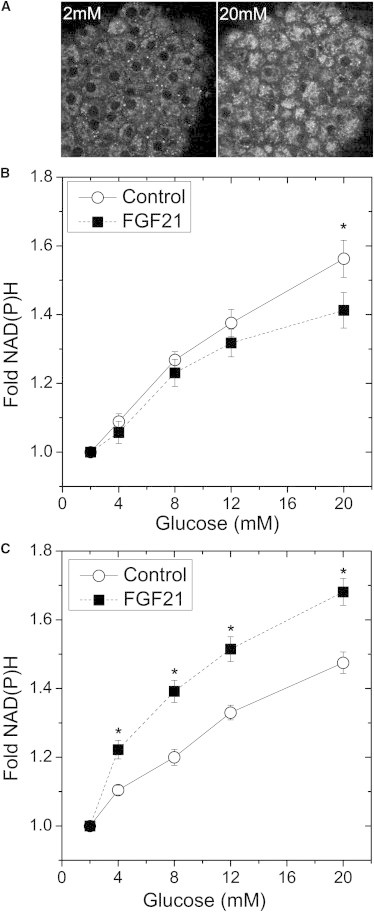
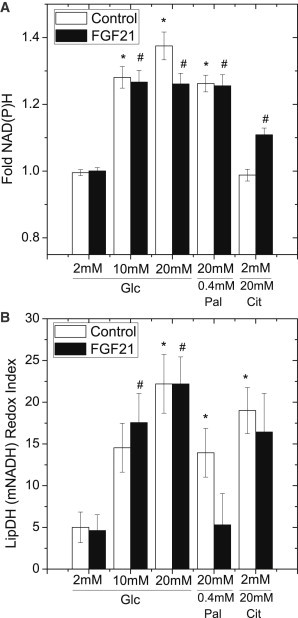
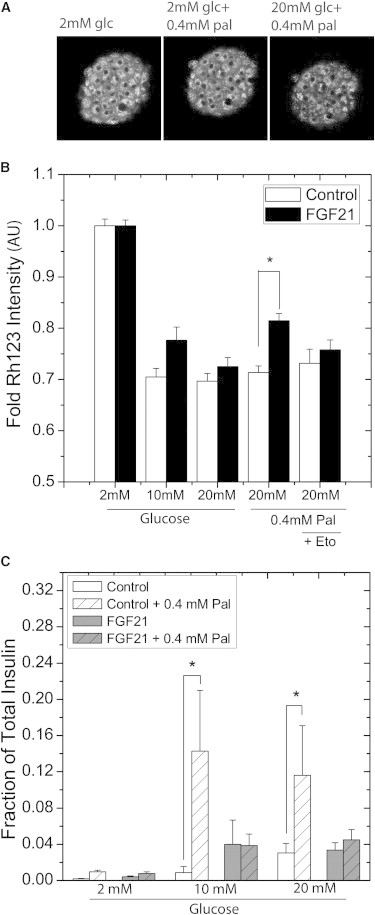
Fibroblast growth factor-21 (FGF21) has therapeutic potential for metabolic syndrome due to positive effects on fatty acid metabolism in liver and white adipose tissue. FGF21 also improves pancreatic islet survival in excess palmitate; however, much less is known about FGF21-induced metabolism in this tissue. We first confirmed FGF21-dependent activity in islets by identifying expression of the cognate coreceptor Klothoβ, and by measuring a ligand-stimulated decrease in acetyl-CoA carboxylase expression. To further reveal the effect of FGF21 on metabolism, we employed a unique combination of two-photon and confocal autofluorescence imaging of the NAD(P)H and mitochondrial NADH responses while holding living islets stationary in a microfluidic device. These responses were further correlated to mitochondrial membrane potential and insulin secretion. Glucose-stimulated responses were relatively unchanged by FGF21. In contrast, responses to glucose in the presence of palmitate were significantly reduced compared to controls showing diminished NAD(P)H, mitochondrial NADH, mitochondrial membrane potential, and insulin secretion. Consistent with the glucose-stimulated responses being smaller due to continued fatty acid oxidation, mitochondrial membrane potential was increased in FGF21-treated islets by using the fatty acid transport inhibitor etomoxir. Citrate-stimulated NADPH responses were also significantly larger in FGF21-treated islets suggesting preference for citrate cycling rather than acetyl-CoA carboxylase-dependent fatty acid synthesis. Overall, these data show a reduction in palmitate-induced potentiation of glucose-stimulated metabolism and insulin secretion in FGF21-treated islets, and establish the use of autofluorescence imaging and microfluidic devices to investigate cell metabolism in a limited amount of living tissue.
Copyright © 2012 Biophysical Society. Published by Elsevier Inc. All rights reserved.
Figures

Similar articles
-
Quantitative imaging of electron transfer flavoprotein autofluorescence reveals the dynamics of lipid partitioning in living pancreatic islets.Integr Biol (Camb). 2012 Aug;4(8):838-46. doi: 10.1039/c2ib20075a. Epub 2012 Jun 25. Integr Biol (Camb). 2012. PMID: 22733276
-
Ca2+ controls slow NAD(P)H oscillations in glucose-stimulated mouse pancreatic islets.J Physiol. 2006 Apr 15;572(Pt 2):379-92. doi: 10.1113/jphysiol.2005.101766. Epub 2006 Feb 2. J Physiol. 2006. PMID: 16455690 Free PMC article.
-
Quantitative NAD(P)H/flavoprotein autofluorescence imaging reveals metabolic mechanisms of pancreatic islet pyruvate response.J Biol Chem. 2004 Jul 23;279(30):31780-7. doi: 10.1074/jbc.M314005200. Epub 2004 May 17. J Biol Chem. 2004. PMID: 15148320
-
Fibroblast growth factor 21 protects against lipotoxicity-induced pancreatic β-cell dysfunction via regulation of AMPK signaling and lipid metabolism.Clin Sci (Lond). 2019 Oct 15;133(19):2029-2044. doi: 10.1042/CS20190093. Clin Sci (Lond). 2019. PMID: 31654570
-
Shedding light on mitochondrial function by real time monitoring of NADH fluorescence: I. Basic methodology and animal studies.J Clin Monit Comput. 2013 Feb;27(1):1-34. doi: 10.1007/s10877-012-9414-5. Epub 2012 Dec 1. J Clin Monit Comput. 2013. PMID: 23203204 Review.
Cited by
-
Microfluidic-enabled quantitative measurements of insulin release dynamics from single islets of Langerhans in response to 5-palmitic acid hydroxy stearic acid.Lab Chip. 2018 Sep 11;18(18):2873-2882. doi: 10.1039/c8lc00624e. Lab Chip. 2018. PMID: 30109329 Free PMC article.
-
Autofluorescence spectroscopy and imaging: a tool for biomedical research and diagnosis.Eur J Histochem. 2014 Dec 12;58(4):2461. doi: 10.4081/ejh.2014.2461. Eur J Histochem. 2014. PMID: 25578980 Free PMC article. Review.
-
Single-cell imaging of α and β cell metabolic response to glucose in living human Langerhans islets.Commun Biol. 2022 Nov 12;5(1):1232. doi: 10.1038/s42003-022-04215-w. Commun Biol. 2022. PMID: 36371562 Free PMC article.
-
Fibroblast growth factor receptor like-1 (FGFRL1) interacts with SHP-1 phosphatase at insulin secretory granules and induces beta-cell ERK1/2 protein activation.J Biol Chem. 2013 Jun 14;288(24):17859-70. doi: 10.1074/jbc.M112.440677. Epub 2013 May 2. J Biol Chem. 2013. PMID: 23640895 Free PMC article.
-
The Roles of White Adipose Tissue and Liver NADPH in Dietary Restriction-Induced Longevity.Antioxidants (Basel). 2024 Jul 8;13(7):820. doi: 10.3390/antiox13070820. Antioxidants (Basel). 2024. PMID: 39061889 Free PMC article. Review.
References
-
- Itoh N., Ornitz D.M. Evolution of the Fgf and Fgfr gene families. Trends Genet. 2004;20:563–569. - PubMed
-
- Kharitonenkov A. FGFs and metabolism. Curr. Opin. Pharmacol. 2009;9:805–810. - PubMed
-
- Badman M.K., Pissios P., Maratos-Flier E. Hepatic fibroblast growth factor 21 is regulated by PPARalpha and is a key mediator of hepatic lipid metabolism in ketotic states. Cell Metab. 2007;5:426–437. - PubMed
-
- Inagaki T., Dutchak P., Kliewer S.A. Endocrine regulation of the fasting response by PPARalpha-mediated induction of fibroblast growth factor 21. Cell Metab. 2007;5:415–425. - PubMed
Publication types
MeSH terms
Substances
Grants and funding
LinkOut - more resources
Full Text Sources
Other Literature Sources
