

Subtypes of primary colorectal tumors correlate with response to targeted treatment in colorectal cell lines
- PMID: 23272949
- PMCID: PMC3543849
- DOI: 10.1186/1755-8794-5-66
Subtypes of primary colorectal tumors correlate with response to targeted treatment in colorectal cell lines
Abstract
Background: Colorectal cancer (CRC) is a heterogeneous and biologically poorly understood disease. To tailor CRC treatment, it is essential to first model this heterogeneity by defining subtypes of patients with homogeneous biological and clinical characteristics and second match these subtypes to cell lines for which extensive pharmacological data is available, thus linking targeted therapies to patients most likely to respond to treatment.
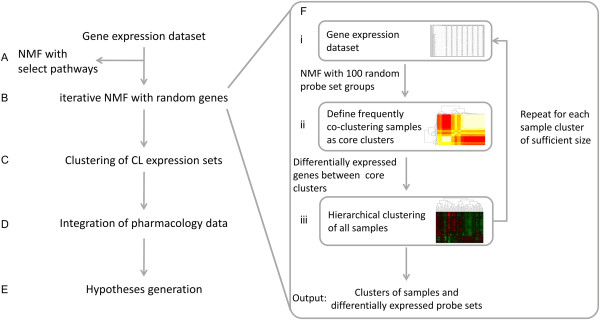
Methods: We applied a new unsupervised, iterative approach to stratify CRC tumor samples into subtypes based on genome-wide mRNA expression data. By applying this stratification to several CRC cell line panels and integrating pharmacological response data, we generated hypotheses regarding the targeted treatment of different subtypes.
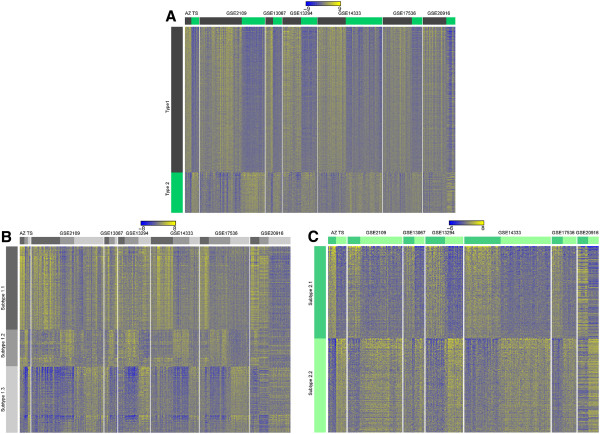
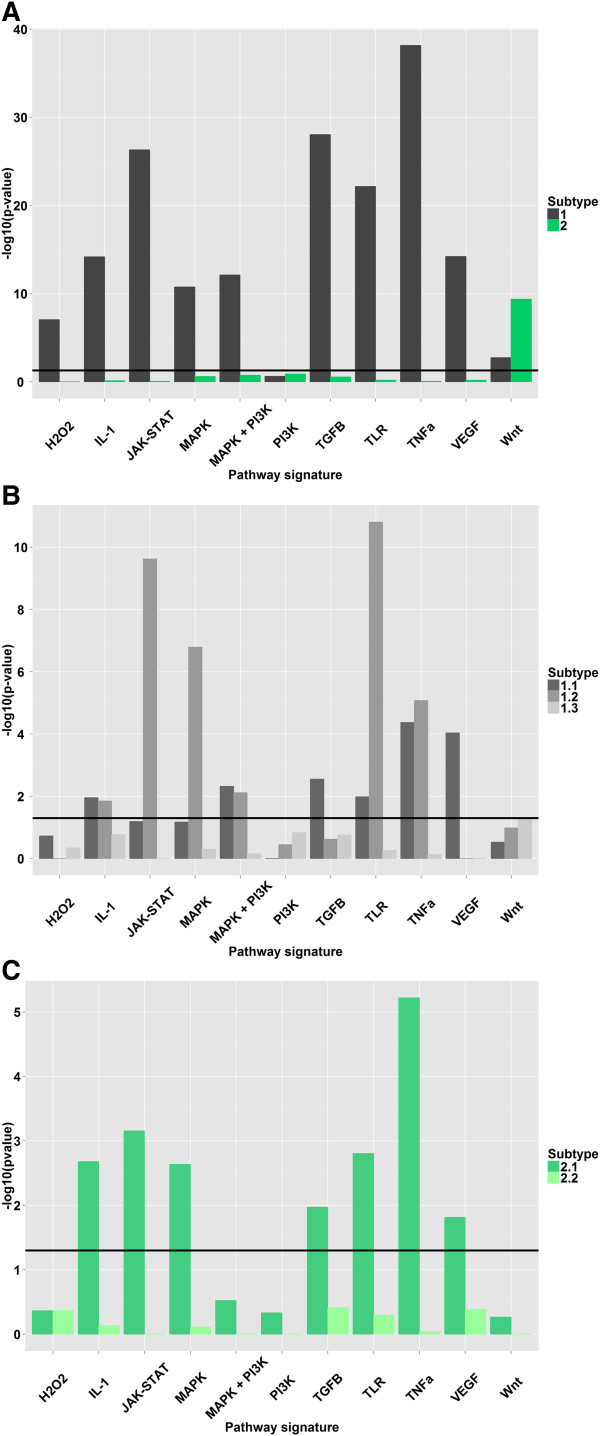
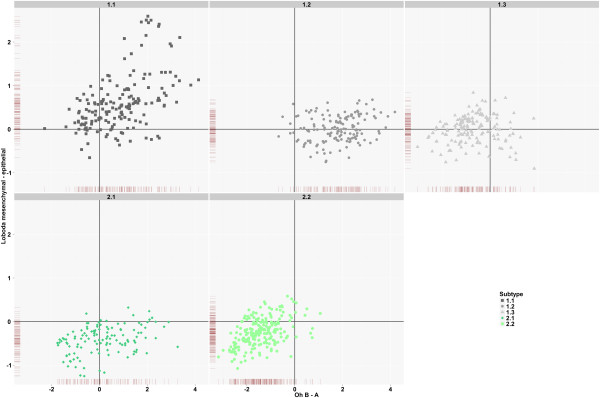
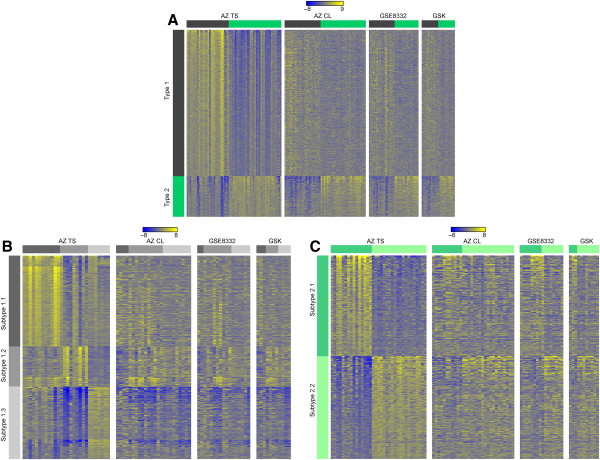
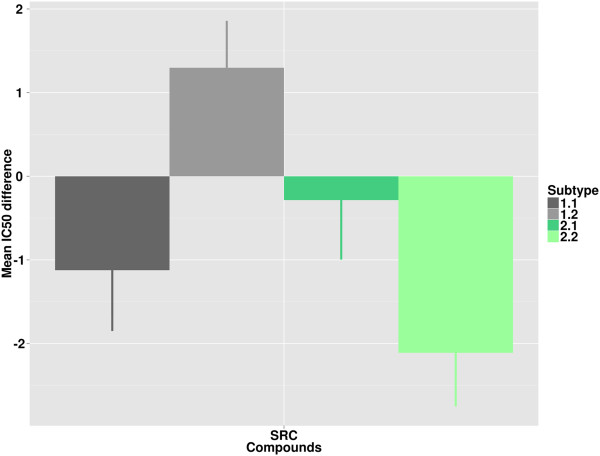
Results: In agreement with earlier studies, the two dominant CRC subtypes are highly correlated with a gene expression signature of epithelial-mesenchymal-transition (EMT). Notably, further dividing these two subtypes using iNMF (iterative Non-negative Matrix Factorization) revealed five subtypes that exhibit activation of specific signaling pathways, and show significant differences in clinical and molecular characteristics. Importantly, we were able to validate the stratification on independent, published datasets comprising over 1600 samples. Application of this stratification to four CRC cell line panels comprising 74 different cell lines, showed that the tumor subtypes are well represented in available CRC cell line panels. Pharmacological response data for targeted inhibitors of SRC, WNT, GSK3b, aurora kinase, PI3 kinase, and mTOR, showed significant differences in sensitivity across cell lines assigned to different subtypes. Importantly, some of these differences in sensitivity were in concordance with high expression of the targets or activation of the corresponding pathways in primary tumor samples of the same subtype.
Conclusions: The stratification presented here is robust, captures important features of CRC, and offers valuable insight into functional differences between CRC subtypes. By matching the identified subtypes to cell line panels that have been pharmacologically characterized, it opens up new possibilities for the development and application of targeted therapies for defined CRC patient sub-populations.
Figures

Similar articles
-
An integrative gene expression signature analysis identifies CMS4 KRAS-mutated colorectal cancers sensitive to combined MEK and SRC targeted therapy.BMC Cancer. 2022 Mar 10;22(1):256. doi: 10.1186/s12885-022-09344-3. BMC Cancer. 2022. PMID: 35272617 Free PMC article.
-
Multi-omics integration identifies a selective vulnerability of colorectal cancer subtypes to YM155.Int J Cancer. 2021 Apr 15;148(8):1948-1963. doi: 10.1002/ijc.33393. Epub 2020 Dec 4. Int J Cancer. 2021. PMID: 33186476
-
Molecular subtypes of colorectal cancer in pre-clinical models show differential response to targeted therapies: Treatment implications beyond KRAS mutations.PLoS One. 2018 Aug 17;13(8):e0200836. doi: 10.1371/journal.pone.0200836. eCollection 2018. PLoS One. 2018. PMID: 30118499 Free PMC article.
-
Genetic Molecular Subtypes in Optimizing Personalized Therapy for Metastatic Colorectal Cancer.Curr Drug Targets. 2018;19(15):1731-1737. doi: 10.2174/1389450119666180803122744. Curr Drug Targets. 2018. PMID: 30073926 Review.
-
Tropomyosin-related kinase B/brain derived-neurotrophic factor signaling pathway as a potential therapeutic target for colorectal cancer.World J Gastroenterol. 2016 Jan 14;22(2):490-500. doi: 10.3748/wjg.v22.i2.490. World J Gastroenterol. 2016. PMID: 26811602 Free PMC article. Review.
Cited by
-
Impact of the Choice of Normalization Method on Molecular Cancer Class Discovery Using Nonnegative Matrix Factorization.PLoS One. 2016 Oct 14;11(10):e0164880. doi: 10.1371/journal.pone.0164880. eCollection 2016. PLoS One. 2016. PMID: 27741311 Free PMC article.
-
Transcriptomic profiling of adjuvant colorectal cancer identifies three key prognostic biological processes and a disease specific role for granzyme B.PLoS One. 2021 Dec 31;16(12):e0262198. doi: 10.1371/journal.pone.0262198. eCollection 2021. PLoS One. 2021. PMID: 34972191 Free PMC article. Clinical Trial.
-
Prognostic role of FUT8 expression in relation to p53 status in stage II and III colorectal cancer.PLoS One. 2018 Jul 5;13(7):e0200315. doi: 10.1371/journal.pone.0200315. eCollection 2018. PLoS One. 2018. PMID: 29975776 Free PMC article.
-
Selective analysis of cancer-cell intrinsic transcriptional traits defines novel clinically relevant subtypes of colorectal cancer.Nat Commun. 2017 May 31;8:15107. doi: 10.1038/ncomms15107. Nat Commun. 2017. PMID: 28561063 Free PMC article.
-
Identification of prognostic genes through expression differentiation during metastatic process in lung adenocarcinoma.Sci Rep. 2017 Sep 11;7(1):11119. doi: 10.1038/s41598-017-11520-6. Sci Rep. 2017. PMID: 28894185 Free PMC article.
References
-
- Tomeo CA, Colditz GA, Willett WC, Giovannucci E, Platz E, Rockhill B, Dart H, Hunter DJ. Harvard report on cancer prevention. Volume 3: prevention of colon cancer in the united states. Cancer Causes Control. 1999;10:167–180. - PubMed
Publication types
MeSH terms
Substances
LinkOut - more resources
Full Text Sources
Other Literature Sources
Medical
Molecular Biology Databases
Research Materials
Miscellaneous
