

Dexamethasone regulates CFTR expression in Calu-3 cells with the involvement of chaperones HSP70 and HSP90
- PMID: 23272037
- PMCID: PMC3521767
- DOI: 10.1371/journal.pone.0047405
Dexamethasone regulates CFTR expression in Calu-3 cells with the involvement of chaperones HSP70 and HSP90
Abstract
Background: Dexamethasone is widely used for pulmonary exacerbation in patients with cystic fibrosis, however, not much is known about the effects of glucocorticoids on the wild-type cystic fibrosis channel transmembrane regulator (CFTR). Our aim was to determine the effects of dexamethasone treatment on wild-type CFTR expression.
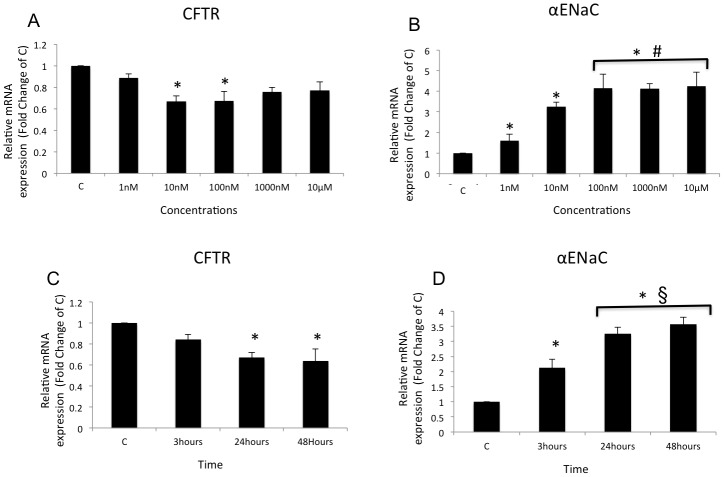
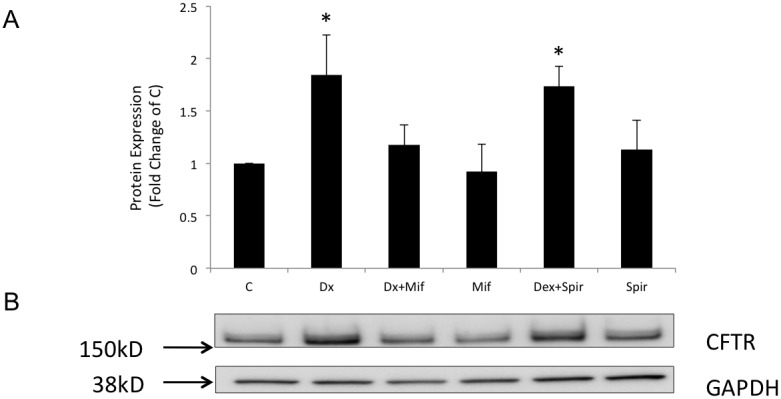
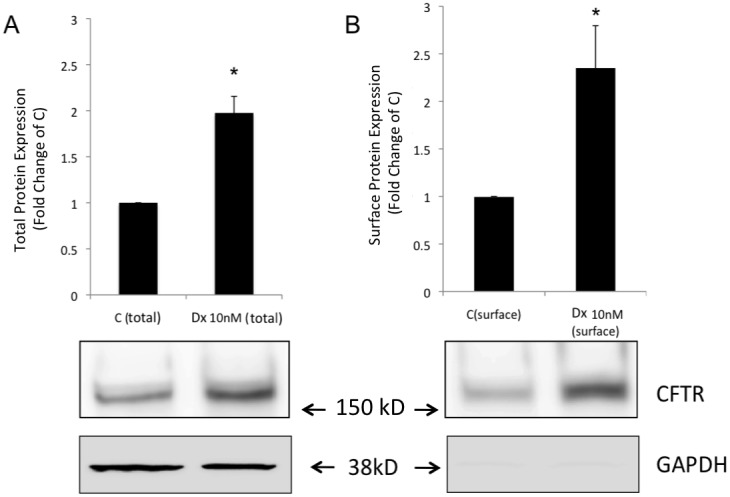
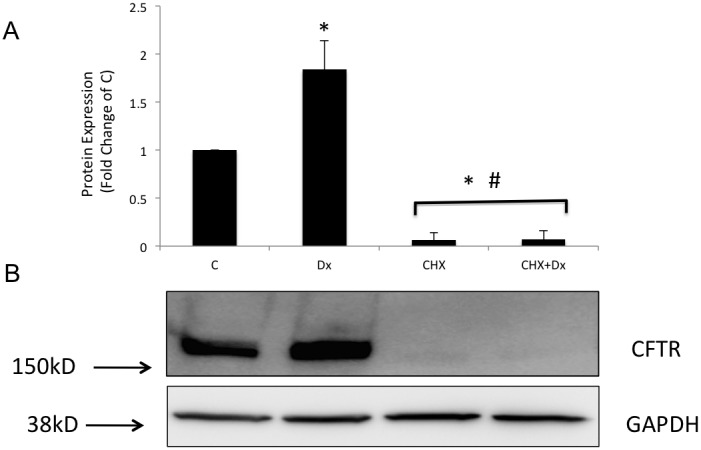
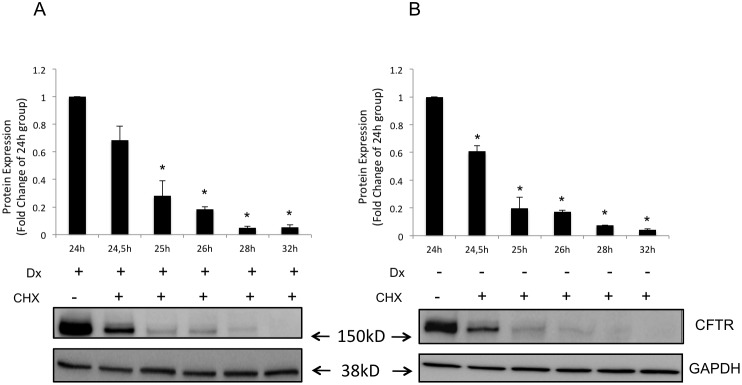
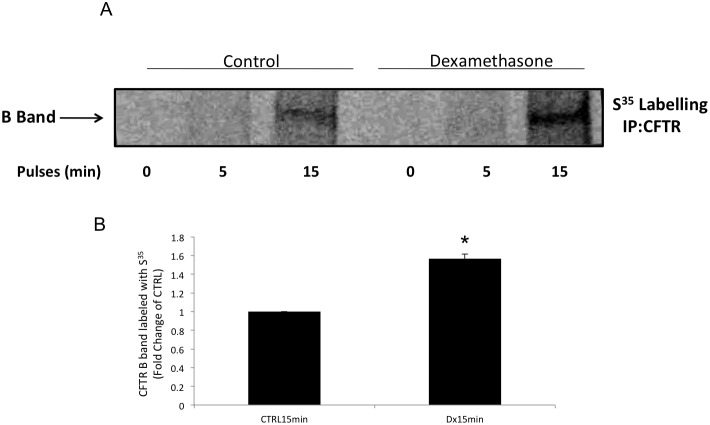
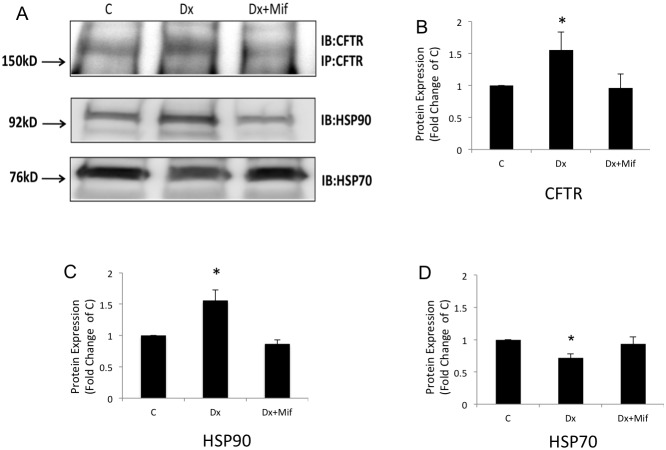
Methods and results: Dose-response (1 nM to 10 µM) and time course (3 to 48 h) curves were generated for dexamethasone for mRNA expression in Calu-3 cells using a real-time PCR. Within 24 h, dexamethasone (10 nM) showed a 0.3-fold decrease in CFTR mRNA expression, and a 3.2-fold increase in αENaC mRNA expression compared with control groups. Dexamethasone (10 nM) induced a 1.97-fold increase in the total protein of wild-type CFTR, confirmed by inhibition by mifepristone. To access surface protein expression, biotinylation followed by Western blotting showed that dexamethasone treatment led to a 2.35-fold increase in the amount of CFTR in the cell surface compared with the untreated control groups. Once protein translation was inhibited with cycloheximide, dexamethasone could not increase the amount of CFTR protein. Protein stability was assessed by inhibition of protein synthesis with cycloheximide (50 µg/ml) at different times in cells treated with dexamethasone and in untreated cells. Dexamethasone did not alter the degradation of wild-type CFTR. Assessment of the B band of CFTR within 15 min of metabolic pulse labeling showed a 1.5-fold increase in CFTR protein after treatment with dexamethasone for 24 h. Chaperone 90 (HSP90) binding to CFTR increased 1.55-fold after treatment with dexamethasone for 24 h, whereas chaperone 70 (HSP70) binding decreased 0.30 fold in an immunoprecipitation assay.
Conclusion: Mature wild-type CFTR protein is regulated by dexamethasone post transcription, involving cotranslational mechanisms with HSP90 and HSP70, which enhances maturation and expression of wild-type CFTR.
Conflict of interest statement
Figures
Similar articles
-
Cysteine string protein monitors late steps in cystic fibrosis transmembrane conductance regulator biogenesis.J Biol Chem. 2006 Apr 21;281(16):11312-21. doi: 10.1074/jbc.M512013200. Epub 2006 Feb 9. J Biol Chem. 2006. PMID: 16469739
-
Glucocorticoids Distinctively Modulate the CFTR Channel with Possible Implications in Lung Development and Transition into Extrauterine Life.PLoS One. 2015 Apr 24;10(4):e0124833. doi: 10.1371/journal.pone.0124833. eCollection 2015. PLoS One. 2015. PMID: 25910246 Free PMC article.
-
The human DnaJ homologue (Hdj)-1/heat-shock protein (Hsp) 40 co-chaperone is required for the in vivo stabilization of the cystic fibrosis transmembrane conductance regulator by Hsp70.Biochem J. 2002 Sep 15;366(Pt 3):797-806. doi: 10.1042/BJ20011717. Biochem J. 2002. PMID: 12069690 Free PMC article.
-
Chaperoning system: Intriguing target to modulate the expression of CFTR in cystic fibrosis.Eur J Med Chem. 2024 Nov 15;278:116809. doi: 10.1016/j.ejmech.2024.116809. Epub 2024 Aug 28. Eur J Med Chem. 2024. PMID: 39226706 Review.
-
Hsp90 and Hsp70 chaperones: Collaborators in protein remodeling.J Biol Chem. 2019 Feb 8;294(6):2109-2120. doi: 10.1074/jbc.REV118.002806. Epub 2018 Nov 6. J Biol Chem. 2019. PMID: 30401745 Free PMC article. Review.
Cited by
-
Dexamethasone ameliorates H₂S-induced acute lung injury by alleviating matrix metalloproteinase-2 and -9 expression.PLoS One. 2014 Apr 10;9(4):e94701. doi: 10.1371/journal.pone.0094701. eCollection 2014. PLoS One. 2014. PMID: 24722316 Free PMC article.
-
Urinary trypsin inhibitor attenuates LPS-induced endothelial barrier dysfunction by upregulation of vascular endothelial-cadherin expression.Inflamm Res. 2016 Mar;65(3):213-24. doi: 10.1007/s00011-015-0907-9. Epub 2015 Dec 17. Inflamm Res. 2016. PMID: 26681130
-
Signaling Cascade Involved in Rapid Stimulation of Cystic Fibrosis Transmembrane Conductance Regulator (CFTR) by Dexamethasone.Int J Mol Sci. 2017 Aug 19;18(8):1807. doi: 10.3390/ijms18081807. Int J Mol Sci. 2017. PMID: 28825630 Free PMC article.
-
Cystic fibrosis transmembrane conductance regulator in COPD: a role in respiratory epithelium and beyond.Eur Respir J. 2023 Apr 1;61(4):2201307. doi: 10.1183/13993003.01307-2022. Print 2023 Apr. Eur Respir J. 2023. PMID: 37003609 Free PMC article. Review.
-
Development and Functional Characterization of Fetal Lung Organoids.Front Med (Lausanne). 2021 Sep 6;8:678438. doi: 10.3389/fmed.2021.678438. eCollection 2021. Front Med (Lausanne). 2021. PMID: 34552939 Free PMC article.
References
-
- Bertrand CA, Frizzell RA (2003) The role of regulated CFTR trafficking in epithelial secretion. Am J Physiol Cell Physiol 285: C1–C18. - PubMed
-
- Bradbury NA (1999) Intracellular CFTR: localization and function. Physiol Rev 79: S175–S191. - PubMed
-
- Vankeerberghen A, Cuppens H, Cassiman JJ (2002) The cystic fibrosis transmembrane conductance regulator: an intriguing protein with pleiotropic functions. J Cystic Fibrosis 1: 13–29. - PubMed
-
- Konstas AA, Koch JP, Tucker SJ, Korbmacher CJ (2002) Cystic fibrosis transmembrane conductance regulator-dependent up-regulation of Kir1.1 (ROMK) renal K+ channels by the epithelial sodium channel. Biol Chem 277: 25377–25384. - PubMed
Publication types
MeSH terms
Substances
Grants and funding
LinkOut - more resources
Full Text Sources
