

Age-related nanostructural and nanomechanical changes of individual human cartilage aggrecan monomers and their glycosaminoglycan side chains
- PMID: 23270863
- PMCID: PMC3578138
- DOI: 10.1016/j.jsb.2012.12.008
Age-related nanostructural and nanomechanical changes of individual human cartilage aggrecan monomers and their glycosaminoglycan side chains
Abstract
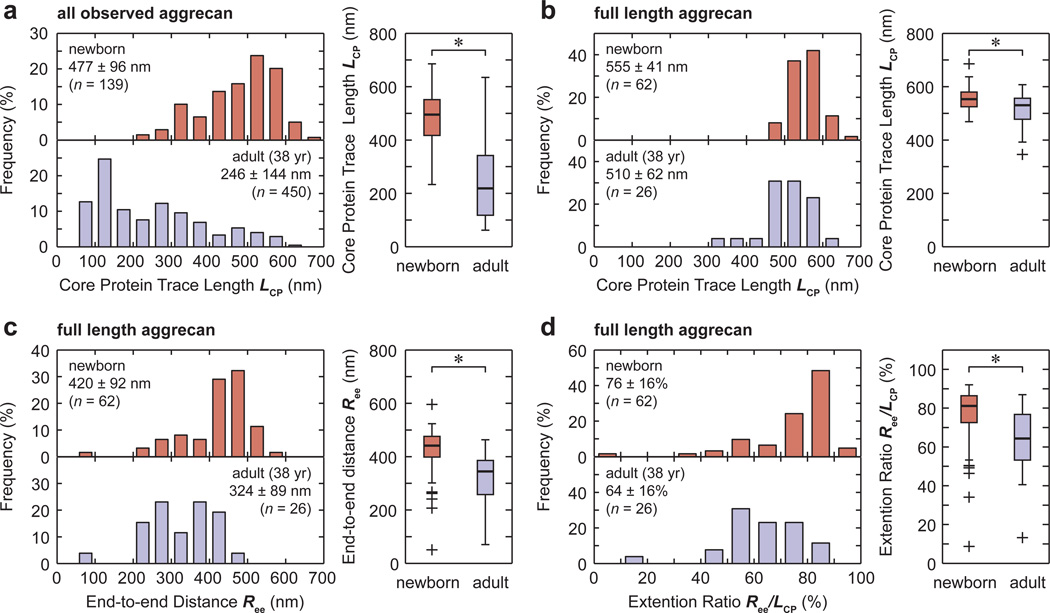
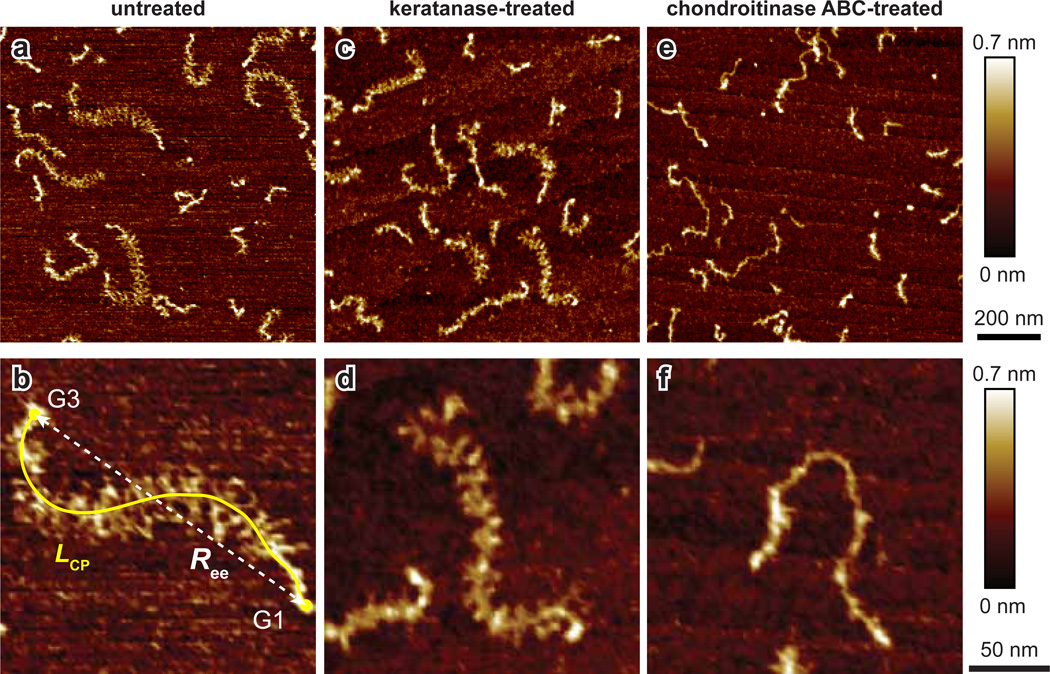
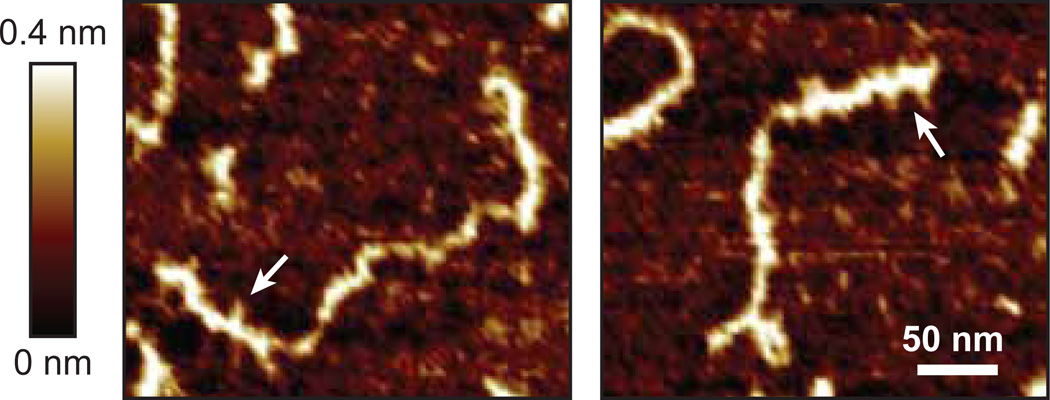
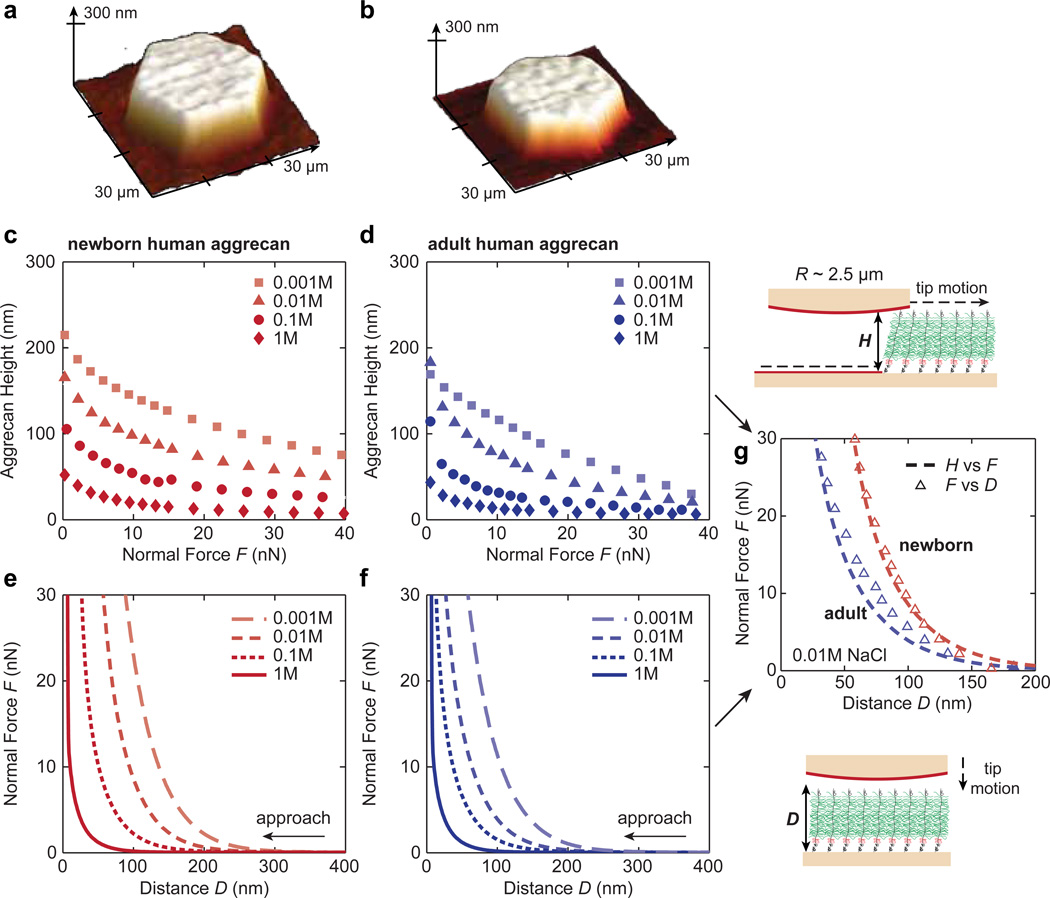
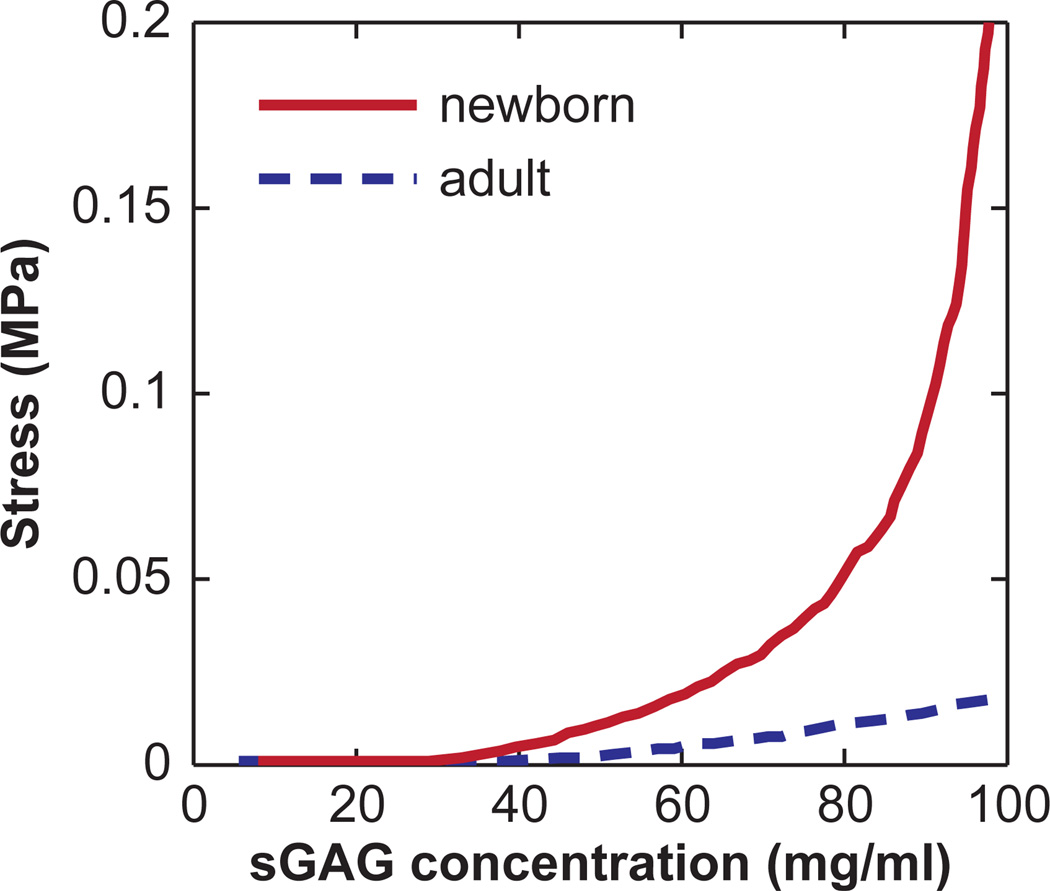
The nanostructure and nanomechanical properties of aggrecan monomers extracted and purified from human articular cartilage from donors of different ages (newborn, 29 and 38 year old) were directly visualized and quantified via atomic force microscopy (AFM)-based imaging and force spectroscopy. AFM imaging enabled direct comparison of full length monomers at different ages. The higher proportion of aggrecan fragments observed in adult versus newborn populations is consistent with the cumulative proteolysis of aggrecan known to occur in vivo. The decreased dimensions of adult full length aggrecan (including core protein and glycosaminoglycan (GAG) chain trace length, end-to-end distance and extension ratio) reflect altered aggrecan biosynthesis. The demonstrably shorter GAG chains observed in adult full length aggrecan monomers, compared to newborn monomers, also reflects markedly altered biosynthesis with age. Direct visualization of aggrecan subjected to chondroitinase and/or keratanase treatment revealed conformational properties of aggrecan monomers associated with chondroitin sulfate (CS) and keratan sulfate (KS) GAG chains. Furthermore, compressive stiffness of chemically end-attached layers of adult and newborn aggrecan was measured in various ionic strength aqueous solutions. Adult aggrecan was significantly weaker in compression than newborn aggrecan even at the same total GAG density and bath ionic strength, suggesting the importance of both electrostatic and non-electrostatic interactions in nanomechanical stiffness. These results provide molecular-level evidence of the effects of age on the conformational and nanomechanical properties of aggrecan, with direct implications for the effects of aggrecan nanostructure on the age-dependence of cartilage tissue biomechanical and osmotic properties.
Copyright © 2012 Elsevier Inc. All rights reserved.
Figures


Similar articles
-
Adult bone marrow stromal cell-based tissue-engineered aggrecan exhibits ultrastructure and nanomechanical properties superior to native cartilage.Osteoarthritis Cartilage. 2010 Nov;18(11):1477-86. doi: 10.1016/j.joca.2010.07.015. Epub 2010 Aug 6. Osteoarthritis Cartilage. 2010. PMID: 20692354 Free PMC article.
-
Compressive nanomechanics of opposing aggrecan macromolecules.J Biomech. 2006;39(14):2555-65. doi: 10.1016/j.jbiomech.2005.09.007. Epub 2005 Nov 9. J Biomech. 2006. PMID: 16289077
-
Individual cartilage aggrecan macromolecules and their constituent glycosaminoglycans visualized via atomic force microscopy.J Struct Biol. 2003 Sep;143(3):242-57. doi: 10.1016/j.jsb.2003.08.006. J Struct Biol. 2003. PMID: 14572479
-
Aggrecan, the Primary Weight-Bearing Cartilage Proteoglycan, Has Context-Dependent, Cell-Directive Properties in Embryonic Development and Neurogenesis: Aggrecan Glycan Side Chain Modifications Convey Interactive Biodiversity.Biomolecules. 2020 Aug 27;10(9):1244. doi: 10.3390/biom10091244. Biomolecules. 2020. PMID: 32867198 Free PMC article. Review.
-
Electron microscopic studies of cartilage proteoglycans.Electron Microsc Rev. 1988;1(1):87-112. doi: 10.1016/s0892-0354(98)90007-7. Electron Microsc Rev. 1988. PMID: 3155020 Review.
Cited by
-
Effects of Inflammation on Multiscale Biomechanical Properties of Cartilaginous Cells and Tissues.ACS Biomater Sci Eng. 2017 Nov 13;3(11):2644-2656. doi: 10.1021/acsbiomaterials.6b00671. Epub 2017 Jan 24. ACS Biomater Sci Eng. 2017. PMID: 29152560 Free PMC article. Review.
-
Distinct effects of different matrix proteoglycans on collagen fibrillogenesis and cell-mediated collagen reorganization.Sci Rep. 2020 Nov 4;10(1):19065. doi: 10.1038/s41598-020-76107-0. Sci Rep. 2020. PMID: 33149218 Free PMC article.
-
Decorin Regulates the Aggrecan Network Integrity and Biomechanical Functions of Cartilage Extracellular Matrix.ACS Nano. 2019 Oct 22;13(10):11320-11333. doi: 10.1021/acsnano.9b04477. Epub 2019 Oct 1. ACS Nano. 2019. PMID: 31550133 Free PMC article.
-
Articular cartilage changes in maturing athletes: new targets for joint rejuvenation.Sports Health. 2014 Jan;6(1):18-30. doi: 10.1177/1941738113514369. Sports Health. 2014. PMID: 24427438 Free PMC article.
-
Nanomechanical phenotype of chondroadherin-null murine articular cartilage.Matrix Biol. 2014 Sep;38:84-90. doi: 10.1016/j.matbio.2014.05.008. Epub 2014 Jun 2. Matrix Biol. 2014. PMID: 24892719 Free PMC article.
References
-
- Bhattacharjee S, Elimelech M. Surface element Integration: a novel technique for evaluation of DLVO interaction between a particle and a flat plate. J. Colloid Interface Sci. 1997;193:273–285. - PubMed
-
- Brown GM, Huckerby TN, Bayliss MT, Nieduszynski IA. Human aggrecan keratan sulfate undergoes structural changes during adolescent development. J. Biol. Chem. 1998;273:26408–26414. - PubMed
-
- Buckwalter JA, Rosenberg LC. Electron microscopic studies of cartilage proteoglycans. Direct evidence for the variable length of the chondroitin sulfate-rich region of proteoglycan subunit core protein. J. Biol. Chem. 1982;257:9830–9839. - PubMed
Publication types
MeSH terms
Substances
Grants and funding
LinkOut - more resources
Full Text Sources
Other Literature Sources
Medical
Miscellaneous
