

Tumor cell-derived placental growth factor sensitizes antiangiogenic and antitumor effects of anti-VEGF drugs
- PMID: 23267058
- PMCID: PMC3545771
- DOI: 10.1073/pnas.1209310110
Tumor cell-derived placental growth factor sensitizes antiangiogenic and antitumor effects of anti-VEGF drugs
Abstract
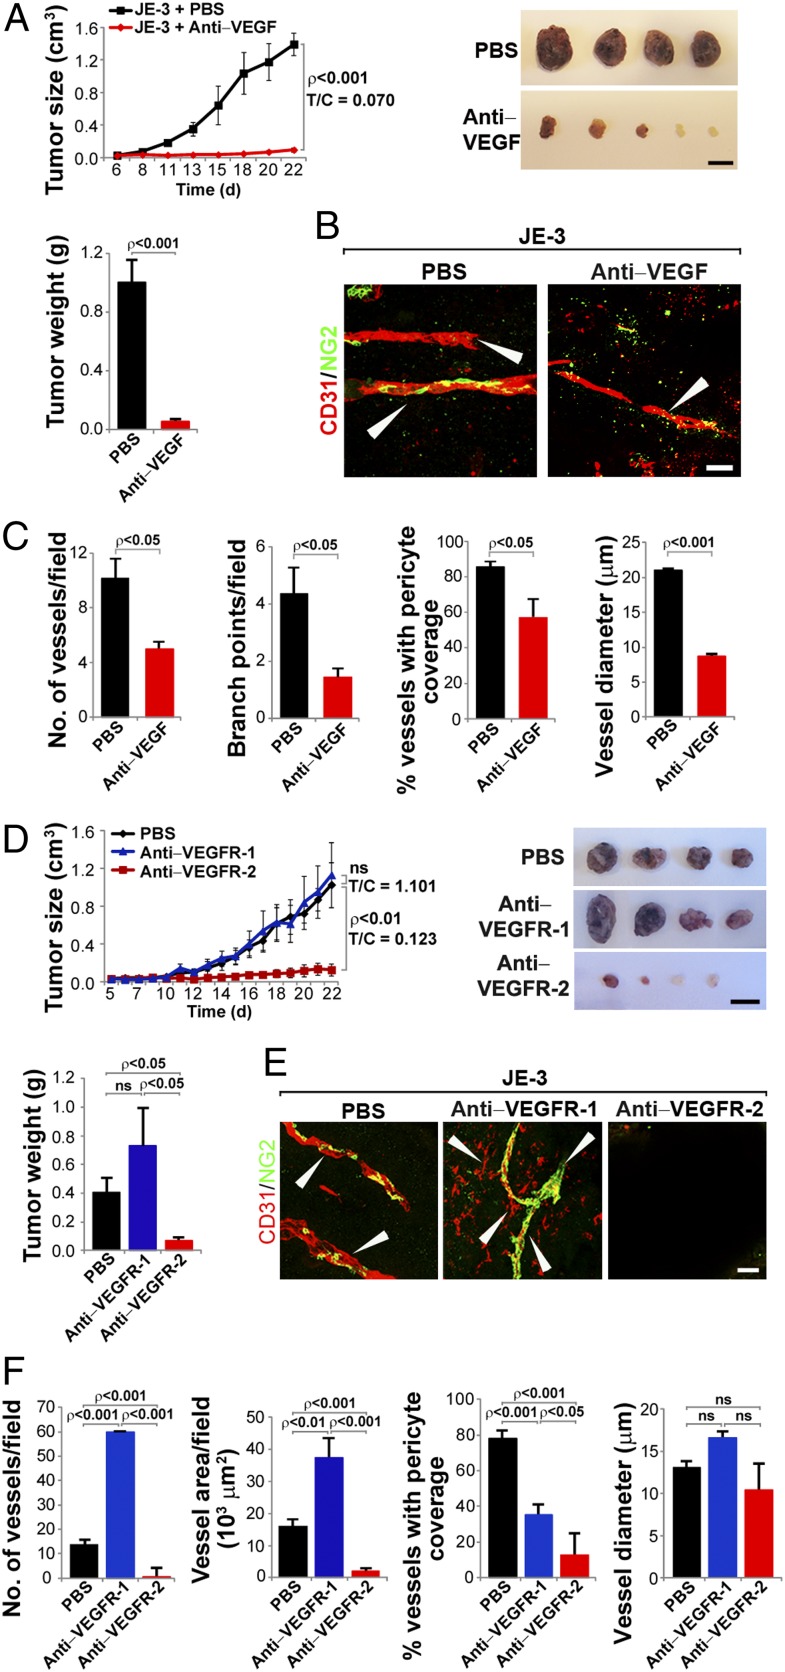
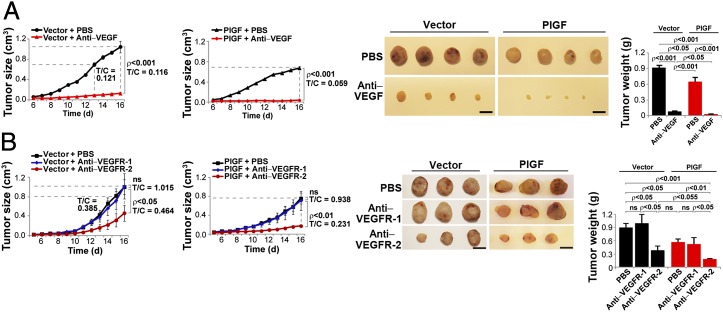
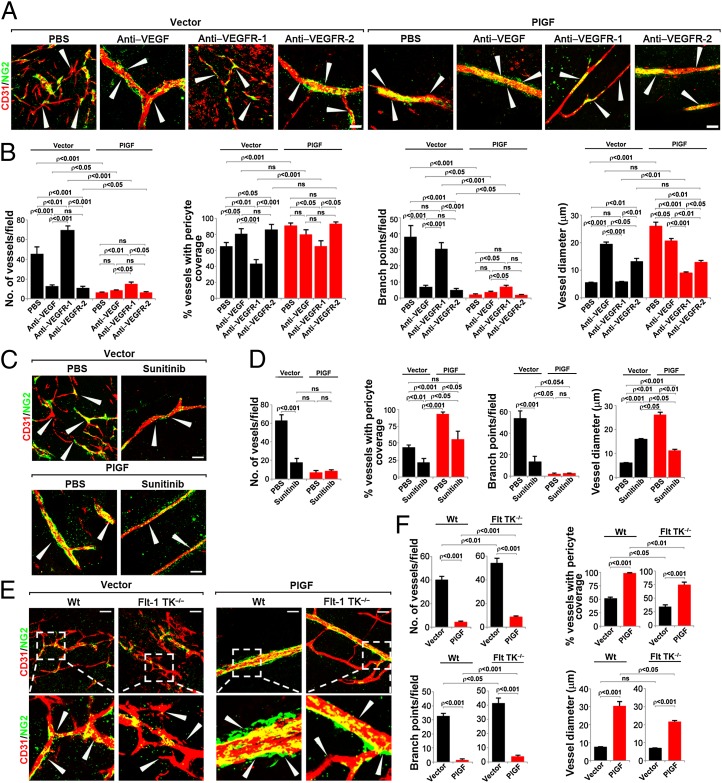
The role of placental growth factor (PlGF) in modulation of tumor angiogenesis and tumor growth remains an enigma. Furthermore, anti-PlGF therapy in tumor angiogenesis and tumor growth remains controversial in preclinical tumor models. Here we show that in both human and mouse tumors, PlGF induced the formation of dilated and normalized vascular networks that were hypersensitive to anti-VEGF and anti-VEGFR-2 therapy, leading to dormancy of a substantial number of avascular tumors. Loss-of-function using plgf shRNA in a human choriocarcinoma significantly accelerated tumor growth rates and acquired resistance to anti-VEGF drugs, whereas gain-of-function of PlGF in a mouse tumor increased anti-VEGF sensitivity. Further, we show that VEGFR-2 and VEGFR-1 blocking antibodies displayed opposing effects on tumor angiogenesis. VEGFR-1 blockade and genetic deletion of the tyrosine kinase domain of VEGFR-1 resulted in enhanced tumor angiogenesis. These findings demonstrate that tumor-derived PlGF negatively modulates tumor angiogenesis and tumor growth and may potentially serve as a predictive marker of anti-VEGF cancer therapy.
Conflict of interest statement
The authors declare no conflict of interest.
Figures

Similar articles
-
Vascular endothelial growth factor-dependent spatiotemporal dual roles of placental growth factor in modulation of angiogenesis and tumor growth.Proc Natl Acad Sci U S A. 2013 Aug 20;110(34):13932-7. doi: 10.1073/pnas.1309629110. Epub 2013 Aug 5. Proc Natl Acad Sci U S A. 2013. PMID: 23918367 Free PMC article.
-
Synergism between vascular endothelial growth factor and placental growth factor contributes to angiogenesis and plasma extravasation in pathological conditions.Nat Med. 2001 May;7(5):575-83. doi: 10.1038/87904. Nat Med. 2001. PMID: 11329059
-
Placental growth factor neutralising antibodies give limited anti-angiogenic effects in an in vitro organotypic angiogenesis model.Angiogenesis. 2010 Dec;13(4):337-47. doi: 10.1007/s10456-010-9190-0. Epub 2010 Oct 16. Angiogenesis. 2010. PMID: 20953695
-
Vascular endothelial growth factor (VEGF), VEGF receptors and their inhibitors for antiangiogenic tumor therapy.Biol Pharm Bull. 2011;34(12):1785-8. doi: 10.1248/bpb.34.1785. Biol Pharm Bull. 2011. PMID: 22130231 Review.
-
Vascular endothelial growth factor (VEGF) - key factor in normal and pathological angiogenesis.Rom J Morphol Embryol. 2018;59(2):455-467. Rom J Morphol Embryol. 2018. PMID: 30173249 Review.
Cited by
-
Notch4+ cancer stem-like cells promote the metastatic and invasive ability of melanoma.Cancer Sci. 2016 Aug;107(8):1079-91. doi: 10.1111/cas.12978. Epub 2016 Jun 28. Cancer Sci. 2016. PMID: 27234159 Free PMC article.
-
Angiotensin-(1-7) Suppresses Hepatocellular Carcinoma Growth and Angiogenesis via Complex Interactions of Angiotensin II Type 1 Receptor, Angiotensin II Type 2 Receptor and Mas Receptor.Mol Med. 2015 Jul 27;21(1):626-36. doi: 10.2119/molmed.2015.00022. Mol Med. 2015. PMID: 26225830 Free PMC article.
-
Broad targeting of angiogenesis for cancer prevention and therapy.Semin Cancer Biol. 2015 Dec;35 Suppl(Suppl):S224-S243. doi: 10.1016/j.semcancer.2015.01.001. Epub 2015 Jan 16. Semin Cancer Biol. 2015. PMID: 25600295 Free PMC article. Review.
-
Dual roles of endothelial FGF-2-FGFR1-PDGF-BB and perivascular FGF-2-FGFR2-PDGFRβ signaling pathways in tumor vascular remodeling.Cell Discov. 2018 Jan 16;4:3. doi: 10.1038/s41421-017-0002-1. eCollection 2018. Cell Discov. 2018. PMID: 29423271 Free PMC article.
-
Flt-1 in colorectal cancer cells is required for the tumor invasive effect of placental growth factor through a p38-MMP9 pathway.J Biomed Sci. 2013 Jun 21;20(1):39. doi: 10.1186/1423-0127-20-39. J Biomed Sci. 2013. PMID: 23799978 Free PMC article.
References
-
- Cao Y, et al. 2011. Forty-year journey of angiogenesis translational research. Sci Transl Med 3(114):114rv113.
-
- Cao Y, Langer R. Optimizing the delivery of cancer drugs that block angiogenesis. Sci Transl Med. 2010;2(15):ps3. - PubMed
-
- Cao Y. Positive and negative modulation of angiogenesis by VEGFR1 ligands. Sci Signal. 2009;2(59):re1. - PubMed
Publication types
MeSH terms
Substances
LinkOut - more resources
Full Text Sources
Molecular Biology Databases
Miscellaneous
