Innate-like CD4 T cells selected by thymocytes suppress adaptive immune responses against bacterial infections
- PMID: 23264931
- PMCID: PMC3525959
- DOI: 10.4236/oji.2012.21004
Innate-like CD4 T cells selected by thymocytes suppress adaptive immune responses against bacterial infections
Abstract
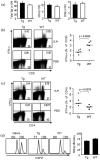
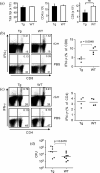
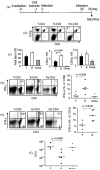
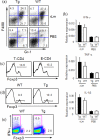
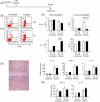
We have reported a new innate-like CD4 T cell population that expresses cell surface makers of effector/memory cells and produce Th1 and Th2 cytokines immediately upon activation. Unlike conventional CD4 T cells that are selected by thymic epithelial cells, these CD4 T cells, named T-CD4 T cells, are selected by MHC class II expressing thymocytes. Previously, we showed that the presence of T-CD4 T cells protected mice from airway inflammation suggesting an immune regulatory role of T-CD4 T cells. To further understand the function of T-CD4 T cells, we investigated immune responses mediated by T-CD4 T cells during bacterial infection because the generation of antigen specific CD4 T cells contributes to clearance of infection and for the development of immune memory. The current study shows a suppressive effect of T-CD4 T cells on both CD8 and CD4 T cell-mediated immune responses during Listeria and Helicobacter infections. In the mouse model of Listeria monocytogenes infection, T-CD4 T cells resulted in decreasedfrequency of Listeria-specific CD8 T cells and the killing activity of them. Furthermore, mice with T-CD4 T cells developed poor immune memory, demonstrated by reduced expansion of antigen-specific T cells and high bacterial burden upon re-infection. Similarly, the presence of T-CD4 T cells suppressed the generation of antigen-specific CD4 T cells in Helicobacter pylori infected mice. Thus, our studies reveal a novel function of T-CD4 T cells in suppressing anti-bacterial immunity.
Figures


Similar articles
-
Low-Level MHC Class II Expression Leads to Suboptimal Th Cell Response, Increased Autoaggression, and Heightened Cytokine Inducibility.J Immunol. 2017 Mar 1;198(5):1928-1943. doi: 10.4049/jimmunol.1600967. Epub 2017 Jan 20. J Immunol. 2017. PMID: 28108557
-
Preformed CD40L is stored in Th1, Th2, Th17, and T follicular helper cells as well as CD4+ 8- thymocytes and invariant NKT cells but not in Treg cells.PLoS One. 2012;7(2):e31296. doi: 10.1371/journal.pone.0031296. Epub 2012 Feb 21. PLoS One. 2012. PMID: 22363608 Free PMC article.
-
Enhancement of the Listeria monocytogenes p60-specific CD4 and CD8 T cell memory by nonpathogenic Listeria innocua.J Immunol. 1999 Apr 15;162(8):4781-9. J Immunol. 1999. PMID: 10202020
-
Thymic regulatory T cells.Autoimmun Rev. 2005 Nov;4(8):579-86. doi: 10.1016/j.autrev.2005.04.010. Autoimmun Rev. 2005. PMID: 16214099 Review.
-
Porcine T lymphocytes and NK cells--an update.Dev Comp Immunol. 2009 Mar;33(3):310-20. doi: 10.1016/j.dci.2008.06.003. Epub 2008 Jul 2. Dev Comp Immunol. 2009. PMID: 18601948 Review.
Cited by
-
A transgenic TCR directs the development of IL-4+ and PLZF+ innate CD4 T cells.J Immunol. 2013 Jul 15;191(2):737-44. doi: 10.4049/jimmunol.1300862. Epub 2013 Jun 17. J Immunol. 2013. PMID: 23776174 Free PMC article.
-
Innate PLZF+CD4+ αβ T cells develop and expand in the absence of Itk.J Immunol. 2014 Jul 15;193(2):673-87. doi: 10.4049/jimmunol.1302058. Epub 2014 Jun 13. J Immunol. 2014. PMID: 24928994 Free PMC article.
-
Bach2 maintains T cells in a naive state by suppressing effector memory-related genes.Proc Natl Acad Sci U S A. 2013 Jun 25;110(26):10735-40. doi: 10.1073/pnas.1306691110. Epub 2013 Jun 10. Proc Natl Acad Sci U S A. 2013. PMID: 23754397 Free PMC article.
References
-
- Germain RN. T-cell development and the CD4-CD8 lineage decision. Nature Reviews Immunology. 2002;2:309–322. doi:10.1038/nri798. - PubMed
-
- Bonduel M, Pozo A, Zelazko M, Raslawski E, Delfino S, Rossi J, Figueroa C, Sackmann MF. Successful related umbilical cord blood transplantation for graft failure following T cell-depleted non-identical bone marrow transplantation in a child with major histo-compatibility complex class II deficiency. Bone Marrow Transplant. 1999;24:437–440. doi:10.1038/sj.bmt.1701915. - PubMed
-
- Godthelp BC, van Eggermond MC, Peijnenburg A, Tezcan I, van Lierde S, van Tol MJ, Vossen JM, van den Elsen PJ. Incomplete T-cell immune reconstitution in two major histocompatibility complex class II-deficiency/bare lymphocyte syndrome patients after HLA-identical sibling bone marrow transplantation. Blood. 1999;94:348–358. - PubMed
-
- Klein C, Cavazzana-Calvo M, Le Deist F, Jabado N, Benkerrou M, Blanche S, Lisowska-Grospierre B, Griscelli C, Fischer A. Bone marrow transplantation in major histocompatibility complex class II deficiency: A single-center study of 19 patients. Blood. 1995;85:580–587. - PubMed
-
- De Smedt M, Hoebeke I, Plum J. Human bone marrow CD34+ progenitor cells mature to T cells on OP9-DL1 stromal cell line without thymus microenvironment. Blood Cells, Molecules, and Diseases. 2004;33:227–232. doi:10.1016/j.bcmd.2004.08.007. - PubMed
Grants and funding
LinkOut - more resources
Full Text Sources
Research Materials
