. 2013 Mar 1;304(5):H687-96.
doi: 10.1152/ajpheart.00744.2012. Epub 2012 Dec 21.

The myosin motor Myo1c is required for VEGFR2 delivery to the cell surface and for angiogenic signaling

Affiliations

The myosin motor Myo1c is required for VEGFR2 delivery to the cell surface and for angiogenic signaling

Ajit Tiwari et al. Am J Physiol Heart Circ Physiol. .

Abstract

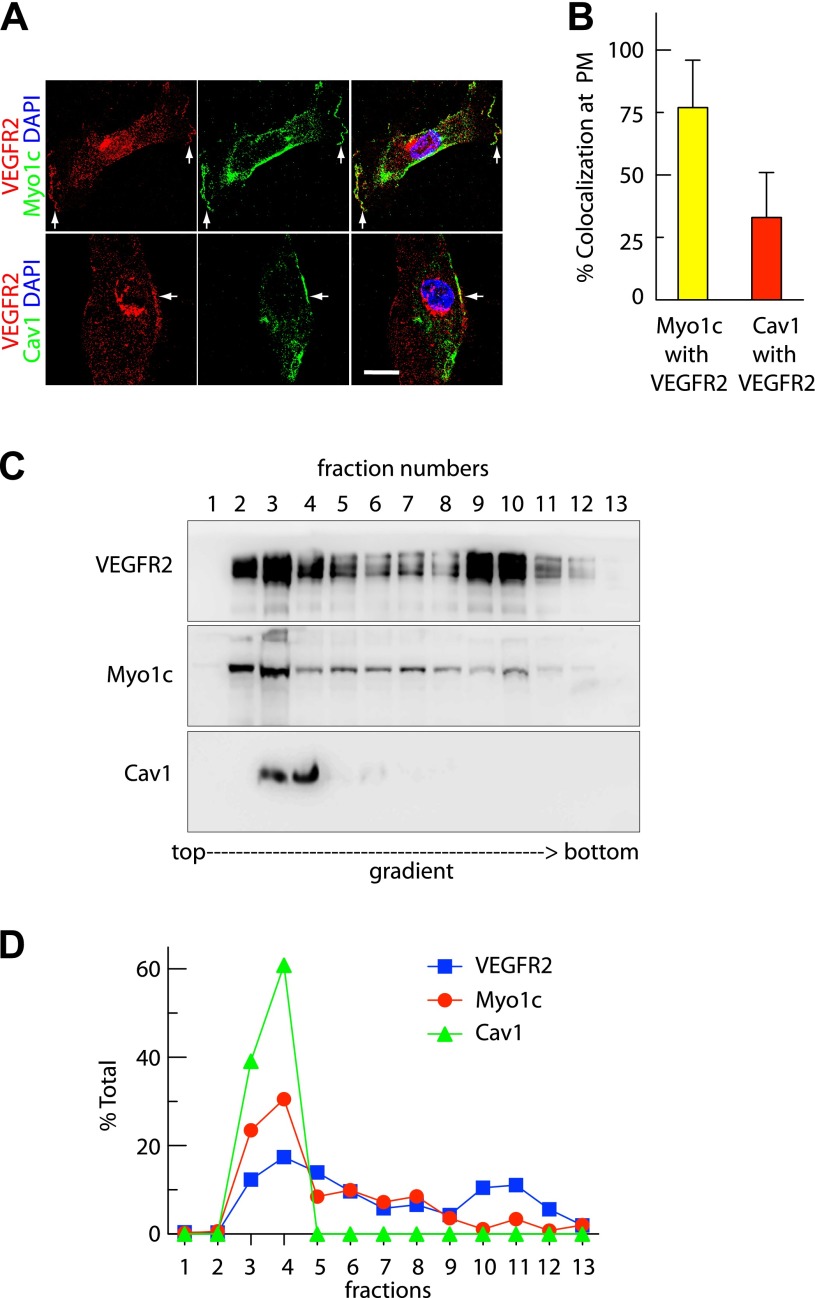
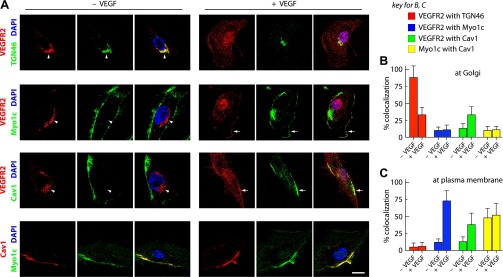
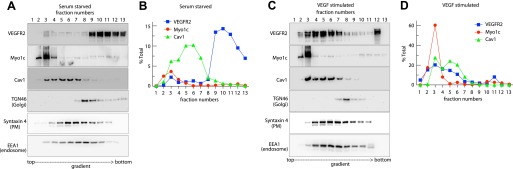
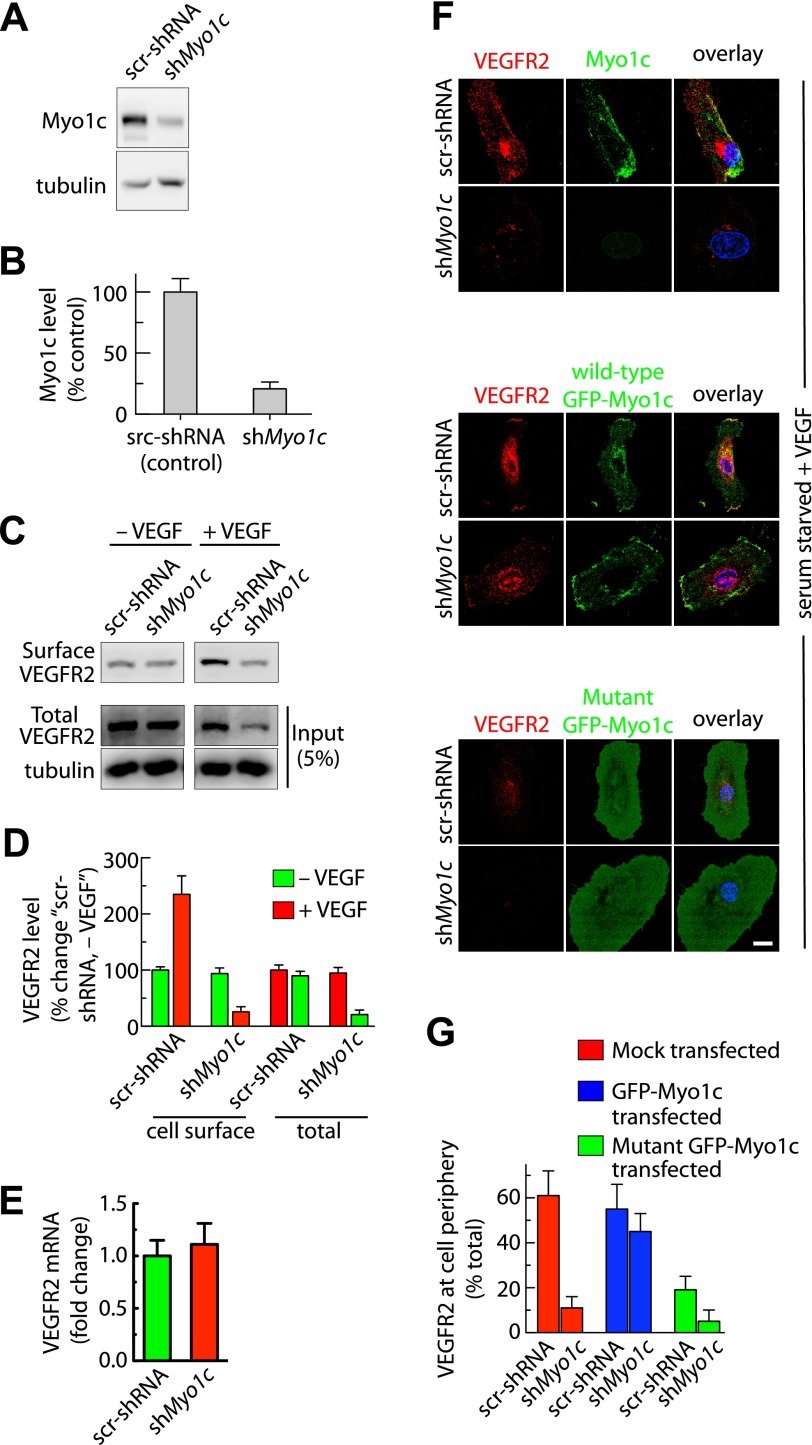
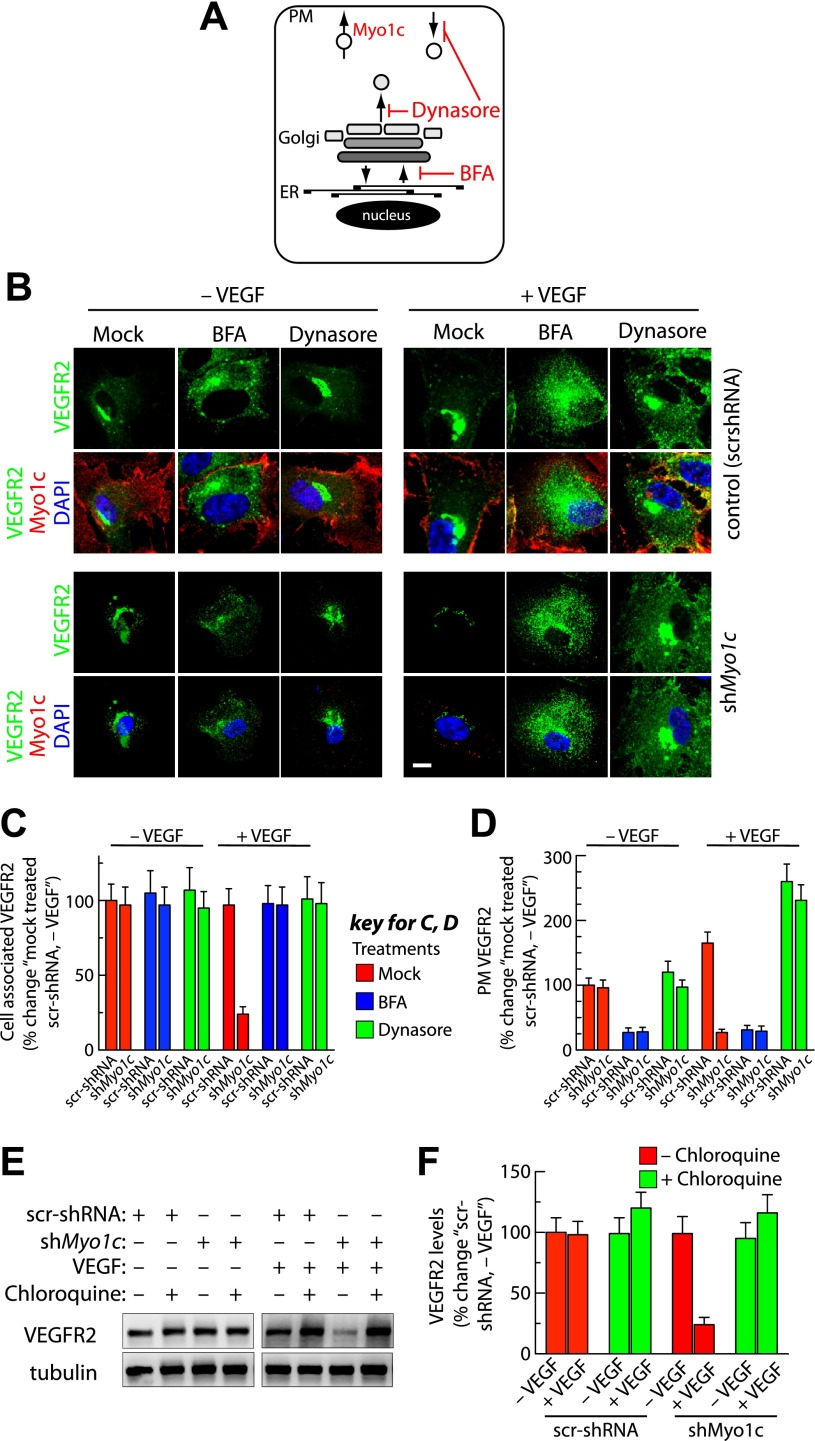
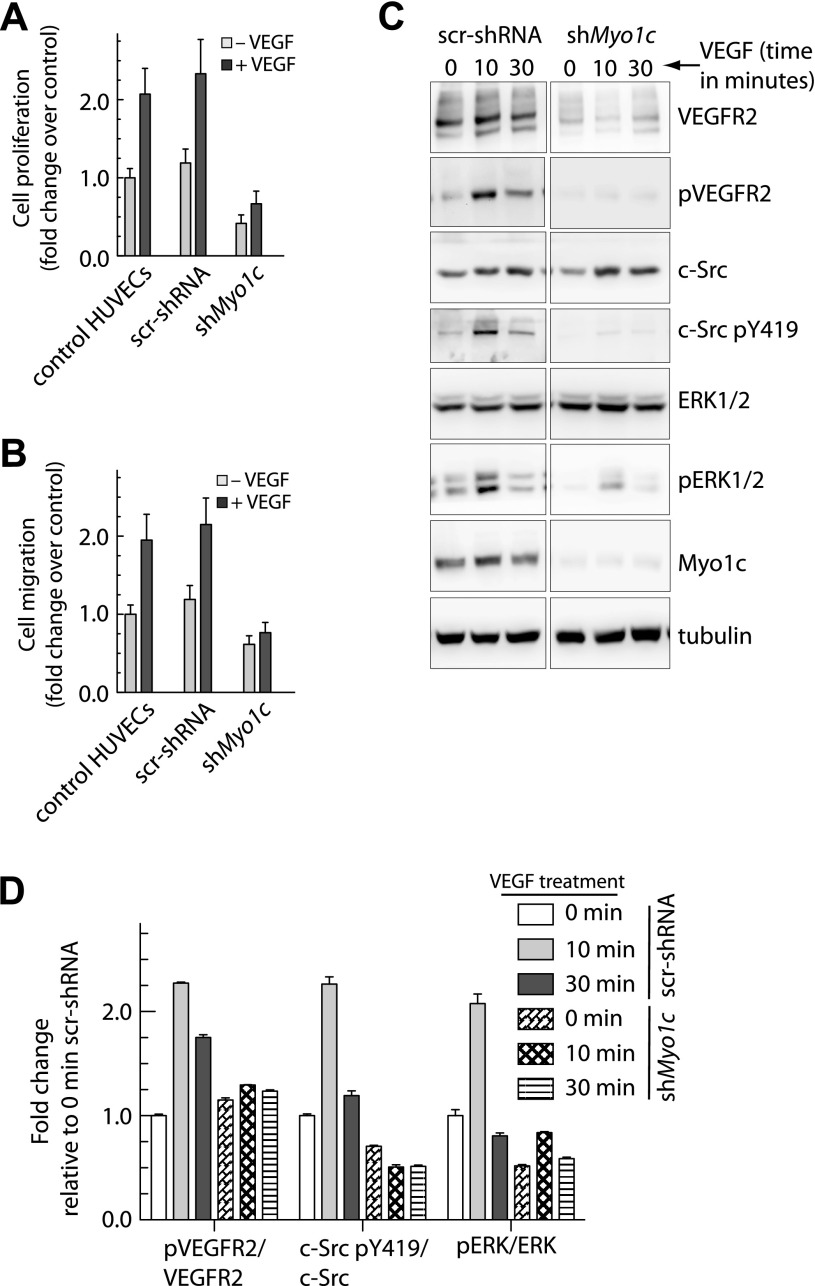
Vascular endothelial growth factor receptor-2 (VEGFR2) is a receptor tyrosine kinase that is expressed in endothelial cells and regulates angiogenic signal transduction under both physiological and pathological conditions. VEGFR2 turnover at the plasma membrane (PM) is regulated by its transport through endocytic and secretory transport pathways. Short-range cargo trafficking along actin filaments is commonly regulated by motor proteins of myosin superfamily. In the current study, performed in primary human endothelial cells, we demonstrate that unconventional myosin 1c (Myo1c; class I family member) regulates the localization of VEGFR2 at the PM. We further demonstrate that the recruitment of VEGFR2 to the PM and its colocalization with Myo1c and caveolin-1 occur in response to VEGF-A (VEGF) stimulation. In addition, VEGF-induced delivery of VEGFR2 to the cell surface requires Myo1c; surface VEGFR2 levels are reduced in the absence of Myo1c and, more importantly, are restored by the overexpression of wild-type but not mutant Myo1c. Subcellular density gradient fractionation revealed that partitioning of VEGFR2 into caveolin-1- and Myo1c-enriched membrane fractions is dependent on VEGF stimulation. Myo1c depletion resulted in increased VEGF-induced VEGFR2 transport to the lysosomes for degradation and was rescued by applying either brefeldin A, which blocks trafficking between the endoplasmic reticulum and the Golgi complex, or dynasore, an inhibitor of dynamin-mediated endocytosis. Myo1c depletion also reduced VEGF-induced VEGFR2 phosphorylation at Y1175 and phosphorylation-dependent activation of ERK1/2 and c-Src kinase, leading to reduced cell proliferation and cell migration. This is the first report demonstrating that Myo1c is an important mediator of VEGF-induced VEGFR2 delivery to the cell surface and plays a role in angiogenic signaling.


Figures

Fig. 1.
Fig. 1.
Vascular endothelial growth factor receptor-2 (VEGFR2) colocalizes with myosin 1c (Myo1c) and caveolin-1 (Cav1) on the endothelial cell surface. Human umbilical vein endothelial cells (HUVECs) cultured in serum-containing complete medium were used. A: representative confocal microscopy image showing colocalization (arrows) between VEGFR2 and Myo1c, and VEGFR2 and Cav1 at the plasma membrane (PM). Scale bar represent 5 μm. DAPI, 4,6-diamidino-2-phenylindole. B: quantification of overlap in fluorescence signal between cell periphery-localized VEGFR2 and Myo1c or Cav1 from images as in A. Value represents mean ± SD; n = 50 cells for each condition from 5 separate experiments (P ≤ 0.05). C: Myo1c associates with VEGFR2 in membrane raft fractions. Cell homogenates were fractionated on a discontinuous OptiPrep gradient, and fractions collected were analyzed by immunoblotting using indicated Abs. Immunoblotting with the Cav1 Ab identified raft fraction (fractions 3 and 4 at the interface of 0 and 30% OptiPrep densities). D: percentage of total VEGFR2, Myo1c, and Cav1 in each fraction, based on quantification of density of bands in each fraction obtained by OptiPrep gradient centrifugation. The percentage represents mean ± SD for n = 3.
Fig. 2.
Fig. 2.
VEGF stimulates the exit of VEGFR2 from Golgi and its relocalization to Myo1c and Cav1-rich rafts at the PM. A–C: effects of VEGF treatment on VEGFR2 localization as previously described (27). Briefly, serum-starved HUVECs were treated with cycloheximide (10 μg/ml) and then cultured without or with VEGF for 30 min. A: confocal immunofluorescence imaging was used to determine VEGFR2, Myo1c, and Cav1 localization. Arrows and arrowheads show PM and Golgi locations, respectively. Scale bar represents 5 μm. B and C: quantification of the overlap in VEGFR2 signal with trans-Golgi network 46 (TGN46), Myo1c, and Cav1 at Golgi and PM. Values were calculated from images as in A using the quantitative colocalization function of Metamorph software as described in materials and methods. Myo1c-Cav1 overlap at the Golgi, and PM was also calculated. Values are expressed as percentages of colocalization of VEGFR2 with TGN46, Cav1, and Myo1c. Percentages represent means ± SD in n = 50 cells for each condition from 5 separate experiments. P ≤ 0.05.
Fig. 3.
Fig. 3.
VEGF mobilizes the nonraft pool of VEGFR2 into Cav1-enriched membrane raft fractions. HUVECs cultured overnight in serum-depleted medium were either mock treated or treated with VEGF-A (50 ng/ml) for 30 min; cell homogenates were fractionated using OptiPrep gradient centrifugation and analyzed via immunoblotting using the indicated Abs. A and C: representative blots indicate the fractionation profiles of VEGFR2, Myo1c, and Cav1 with respect to markers for PM (syntaxin 4), endosomes (EEA1), Golgi (TGN46) in serum-starved cells and VEGF-stimulated cells, respectively. B and D: densitometric quantification of bands in each OptiPrep gradient fraction is represented as the percentage of total VEGFR2, Myo1c, or Cav1 in each fraction of serum-starved cells, either untreated or treated with VEGF. The percentage given is the mean ± SD for n = 3 experiments.
Fig. 4.
Fig. 4.
Depletion of Myo1c reduces cell-surface and total cellular level of VEGFR2. Puromycin-selected stable HUVECs after infection with recombinant lentiviruses expressing control scrambled small hairpin RNA (scr-shRNA) or shRNA against human Myo1c (shMyo1c). A: total cell lysates were analyzed with the indicated Abs by immunoblotting to assess the levels of Myo1c and VEGFR2. Representative blots are shown. B: Myo1c and VEGFR2 band densities from A and C were quantified; values represent relative levels of Myo1c and VEGFR2 after normalization to an arbitrary value of 100% set at the level in control shRNA cells. The percentage represents the mean ± SD for n = 3. C: biotinylation-based analysis of cell-surface VEGFR2. Serum-starved or VEGF-treated scr-shRNA or shMyo1c-expressing cells were used to label surface proteins with the biotinylation reagent sulfo-NHS-SS-biotin. Cell-surface biotinylated proteins were pulled down with streptavidin-Sepharose, and 5% of the total cell lysate and biotinylated cell-surface protein was separated by sodium dodecyl sulfate-polyacrylamide gel electrophoresis followed by Western blot analysis with antibody against VEGFR2. D: quantification of band density for the cell-surface and total VEGFR2. Percentage is expressed as the change in VEGFR2 [relative to scr-shRNA-expressing cells without VEGF treatment (−VEGF)]. The percentage represents mean ± SD for n = 3 and P ≤ 0.03. E: stable endothelial lines expressing shRNAs were cultured in complete medium containing serum before levels of the VEGFR2 mRNA were analyzed. Quantitative RT-PCR analysis showing VEGFR2 transcript levels in shMyo1c relative to the control shRNA-expressing stable line. Data are expressed as means ± SE; n = 3. F: overexpression of green fluorescent protein (GFP)-Myo1c but not mutant GFP-Myo1c restores VEGFR2 levels in Myo1c-depleted cells in response to VEGF. scr-shRNA or shMyo1c expressing stable lines were either mock transfected or transfected with Myo1c-GFP or mutant Myo1c-GFP [(Myo1c 690-1028), lacking both ATP and actin-binding domains, dominant negative form (1)]. After 36 h of transfection, cells were serum starved for 16 h, followed by VEGF treatment (30 min). Immunolocalization of VEGFR2 and Myo1c was performed by epifluorescence microscopy. Fluorescence images of representative field are shown. Scale bar represents 5 μm. G: quantitation of relative levels of VEGFR2 at the PM. VEGFR2 antibody staining along the cell edges and total cell associated was quantified by Metamorph image analysis. Values represent relative changes in the levels of VEGFR2 at the cell periphery (calculated as %total cell-associated VEGFR2). Results are expressed as means ± SE; n = 70 cells for each condition from 3 separate experiments and P ≤ 0.05.
Fig. 5.
Fig. 5.
Myo1c depletion targets post-Golgi and PM pool of VEGFR2 for degradation in response to VEGF stimulation. A: schematic diagram showing the direction of vesicular cargo transport along endocytic and secretory pathways, as well as the known intracellular sites of action of brefeldin A (BFA), dynasore, and proposed site where Myo1c may be involved in facilitating VEGFR2 delivery to the PM. ER, endoplasmic reticulum. B: stable cells were serum starved for 6 h. Cells were then either mock pretreated or pretreated with BFA (1 μg/ml, 2 h) or dynasore (80 μM in DMSO, 2 h) before being cultured in the absence or presence of VEGF (50 ng/ml, 30 min) in medium containing respective inhibitors. Cells were then fixed, permeabilized, and labeled with Abs specific for VEGFR2 and Myo1c, followed by incubation with the appropriate fluorescently tagged secondary Ab. Representative images obtained by epifluorescence microscopy show localization of VEGFR2. Scale bar represents 5 μm. C: quantification of intracellular retention of VEGFR2 upon BFA and dynasore treatments as in B. Total cell-associated fluorescence was quantified by image analysis. Values represent relative changes in the levels of VEGFR2 normalized to an arbitrary value of 100% for mock-treated control (scr-shRNA, -VEGF). Results are expressed as means ± SE; n = 70 cells for each condition from 3 separate experiments and P ≤ 0.03. D: in a similar study as in B, confocal imaging was performed to quantitatively access VEGFR2 levels at the PM. Fluorescence signal of VEGFR2 at cell periphery from the confocal images was quantified by Metamorph image analysis. Value represents mean ± SD; n = 30 cells for each condition from 3 separate experiments and P ≤ 0.05. E: Stable scr-shRNA or shMyo1c cells were serum starved for 6 h before treatment for an additional 6 h with or without chloroquine (100 μM). Pretreated samples were then incubated in the presence or absence of VEGF in medium with or without chloroquine. F: quantification of band density for total VEGFR2. Values are expressed as the percent changes in VEGFR2 [relative to scr-shRNA (−VEGF)]. The percentage represents mean ± SD for n = 3 and P ≤ 0.05.
Fig. 6.
Fig. 6.
Depletion of Myo1c blocks VEGFR2 signaling associated with VEGF-induced cell proliferation and migration. A: stably selected endothelial cells expressing shRNAs were serum starved and then cultured in the presence or absence of VEGF. Cell proliferation was determined using the 3-[4,5-dimethylthiazol-2-yl]-2,5-diphenyltetrazolium bromide (MTT) assay. Values are expressed as fold changes relative to that in control shRNA expressing cells. B: directional migration of stable endothelial cells toward VEGF (100 ng/ml) by Boyden chamber assay in the presence or absence of VEGF in the lower well. The number of migrating cells assessed by crystal violet dye extraction was normalized to the number in control (−VEGF) cells. Data in A and B are means ± SD from 4 independent experiments. P ≤ 0.001 in A, and P ≤ 0.005 in B. C: stable endothelial cells expressing control shRNA or shMyo1c were cultured in serum-depleted medium and treated with VEGF-A (50 ng/ml) for the indicated times; total cell lysate was immunoblotted for VEGFR2, VEGFR2 phosphorylated at Y1175 (pVEGFR2), c-Src, c-Src phosphorylated at Y419 (c-Src pY419), ERK1/2, phosphorylated form of ERK1/2. Representative blots are shown (n = 3). D: band densities were quantified, and values represent relative levels of protein phosphorylation (at various time points of VEGF treatment) after normalization to arbitrary value of 100% for cells expressing a control scr-shRNA (n = 4).

Similar articles

Cited by

References

    1. Arif E, Wagner MC, Johnstone DB, Wong HN, George B, Pruthi PA, Lazzara MJ, Nihalani D. Motor protein Myo1c is a podocyte protein that facilitates the transport of slit diaphragm protein Neph1 to the podocyte membrane. Mol Cell Biol 31: 2134–2150, 2011 - PMC - PubMed
    1. Bahler M, Rhoads A. Calmodulin signaling via the IQ motif. FEBS Lett 513: 107–113, 2002 - PubMed
    1. Ballmer-Hofer K, Andersson AE, Ratcliffe LE, Berger P. Neuropilin-1 promotes VEGFR-2 trafficking through Rab11 vesicles thereby specifying signal output. Blood 118: 816–826, 2011 - PubMed
    1. Barletta GM, Kovari IA, Verma RK, Kerjaschki D, Holzman LB. Nephrin and Neph1 co-localize at the podocyte foot process intercellular junction and form cis hetero-oligomers. J Biol Chem 278: 19266–19271, 2003 - PubMed
    1. Barylko B, Jung G, Albanesi JP. Structure, function, and regulation of myosin 1C. Acta Biochim Pol 52: 373–380, 2005 - PubMed

Publication types

MeSH terms

LinkOut - more resources