. 2013 Jan;123(1):179-88.
doi: 10.1172/JCI64617. Epub 2012 Dec 21.

Treg-mediated suppression of atherosclerosis requires MYD88 signaling in DCs

Affiliations

Treg-mediated suppression of atherosclerosis requires MYD88 signaling in DCs

Manikandan Subramanian et al. J Clin Invest. 2013 Jan.

Abstract

TLR activation on CD11c+ DCs triggers DC maturation, which is critical for T cell activation. Given the expansion of CD11c+ DCs during the progression of atherosclerosis and the key role of T cell activation in atherogenesis, we sought to understand the role of TLR signaling in CD11c+ DCs in atherosclerosis. To this end, we used a mouse model in which a key TLR adaptor involved in DC maturation, MYD88, is deleted in CD11c+ DCs. We transplanted bone marrow containing Myd88-deficient CD11c+ DCs into Western diet-fed LDL receptor knockout mice and found that the transplanted mice had decreased activation of effector T cells in the periphery as well as decreased infiltration of both effector T cells and Tregs in atherosclerotic lesions. Surprisingly, the net effect was an increase in atherosclerotic lesion size due to an increase in the content of myeloid-derived inflammatory cells. The mechanism involves increased lesional monocyte recruitment associated with loss of Treg-mediated suppression of MCP-1. Thus, the dominant effect of MYD88 signaling in CD11c+ DCs in the setting of atherosclerosis is to promote the development of atheroprotective Tregs. In the absence of MYD88 signaling in CD11c+ DCs, the loss of this protective Treg response trumps the loss of proatherogenic T effector cell activation.


Figures

Figure 1
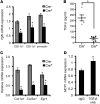
Figure 1. Maturation of splenic DCs is inhibited in WD-fed Ldlr–/– mice transplanted with bone marrow from Cre+ mice.
For this figure and the following 5 figures, Ldlr–/– mice transplanted with Cre or Cre+ bone marrow were fed WD for 10 weeks. For the data here, n = 10 mice per group unless otherwise indicated. (A) Percentage of CD11chi DCs expressing the DC maturation marker CD86 or CD40 in the spleens of Cre or Cre+ mice. (B) Representative flow cytometric dot plots of CD3+-gated splenocytes, demonstrating the distribution of naive (CD62LhiCD44lo) and effector T cells (CD62LloCD44hi) in Cre and Cre+ mice. The scatter plot shows the quantification of the splenic naive/effector T cell ratio. (C) The indicated cytokine mRNA levels were determined by RT-qPCR analysis of RNA isolated from the spleens of Cre or Cre+ mice (n = 5 mice per group). All data were normalized to the expression of Gapdh. (D) Flow cytometric quantification of Treg numbers in the spleens of Cre and Cre+ mice, expressed as a percentage of total CD4+ T cells. For all panels, *P < 0.05. n.s., not significant. Symbols represent individual mice; horizontal bars indicate the mean.
Figure 2
Figure 2. Lesional T cells are decreased in WD-fed Ldlr–/– mice transplanted with bone marrow from Cre+ mice.
(A) Naive (CD62LhiCD44lo)/effector (CD62LloCD44hi) T cell ratio and percentage of Tregs (CD4+CD25+FoxP3+), as determined by flow cytometry in the iliac lymph nodes of Cre and Cre+ mice (n = 5 mice per group). (B and C) Number of CD11chiCD83hi cells and CD3+ cells per section in the atherosclerotic lesions of Cre and Cre+ mice, as determined by quantitative immunofluorescence microscopy (n = 10 mice per group). (D and F) The indicated mRNA levels were determined by RT-qPCR analysis of RNA captured from CD11clo regions of the plaques of Cre and Cre+ mice (n = 5 mice per group). The data were normalized to Gapdh mRNA expression. (E) Flow cytometric quantification of Tregs (CD4+CD25+FoxP3+) expressed as a percentage of total CD4+ cells obtained from aortic extracts of Cre and Cre+ mice. The recovery efficiency of aortic leukocytes was >80% (n = 5 mice for Cre and 6 mice for Cre+). For all panels, *P < 0.05. Symbols represent individual mice; horizontal bars indicate the mean.
Figure 3
Figure 3. Atherosclerosis is increased in WD-fed Ldlr–/– mice transplanted with bone marrow from Cre+ mice.
(A) H&E staining of representative aortic root sections demonstrating larger lesion size in Ldlr–/– mice transplanted with bone marrow from Cre+ mice. The atherosclerotic lesions are demarcated by the dashed lines. Scale bar: 10 μm. The scatter plot shows the quantified data from 15 Cre and 16 Cre+ mice. (B) Representative images of Oil red O–stained thoracic aorta showing lesional area in Cre and Cre+ mice. The scatter plot shows the quantified data from 6 Cre and 5 Cre+ mice. (C and D) Plasma cholesterol and total triglycerides in Cre and Cre+ mice, respectively. (E) Distribution of VLDL, LDL, and HDL cholesterol by fast performance liquid chromatography of pooled plasma samples. (F) Number of CD11cF4/80+ (macrophages), CD11chi (DCs), and smooth muscle (sm-actin+) cells (SMCs) per section in the atherosclerotic lesions of Cre and Cre+ mice, as determined by quantitative immunofluorescence microscopy (n = 10 mice per group). For all panels, *P < 0.05. Symbols represent individual mice; horizontal bars indicate the mean.
Figure 4
Figure 4. Recruitment of monocytes into atherosclerotic lesions is enhanced in WD-fed Ldlr–/– mice transplanted with bone marrow from Cre+ mice through an MCP-1 mechanism.
(A) Representative images demonstrating increased fluorescent bead-labeled monocytes (green staining, indicated by red arrows) in atherosclerotic lesions of Cre+ mice. Nuclei are stained with Hoechst 33342 (blue). Scale bar: 10 μm. The bar graph shows quantification of the number of labeled cells per section in aortic root lesions of Cre (n = 4) and Cre+ (n = 5) mice. (B) Peripheral blood monocytes were quantified by CD115 staining using flow cytometry and expressed as a percentage of CD45+ leukocytes (n = 10 mice per group). (C) Flow cytometric analysis of distribution of Ly6Chi and Ly6Clo monocyte subsets of CD45+CD115+-gated leukocytes (monocytes). (D) Quantification of MCP1 mRNA in RNA isolated from CD11chi, CD11clo, and smooth muscle actin (sm-actin+) regions of atherosclerotic lesions of Cre and Cre+ mice. The data were normalized to expression of Gapdh (n = 5 mice per group). (E) Measurement of serum MCP-1 levels by ELISA in Cre and Cre+ mice (n = 10 mice per group). (F) Fluorescence microscopy-based quantification of the number of bead-labeled cells per lesion section of Cre or Cre+ mice injected with IgG or MCP-1–neutralizing antibody (MCP-1 nAb) on days 1, 3, and 8 prior to the end of the WD-feeding period. For all panels, *P < 0.05. Symbols represent individual mice; horizontal bars indicate the mean.
Figure 5
Figure 5. Evidence that MyD88 deficiency in CD11c+ cells abrogates Treg-mediated suppression of MCP-1 and monocyte recruitment in the lesions of WD-fed Ldlr–/– mice.
(A) WD-fed Ldlr–/– mice transplanted with bone marrow from Cre mice were injected with anti-CD25 IgG to deplete Tregs or with control IgG. Two weeks later, the mRNA levels of the indicated targets were assayed in LCM-captured RNA obtained from CD11clo regions of atherosclerotic lesions. The data were normalized to the expression level of Gapdh mRNA (n = 5 mice per group). (B) Quantification of the number of fluorescent bead-labeled cells per section in control and Treg-depleted Cre mice (n = 3 mice per group). (C and D) Tregs were adoptively transferred into WD-fed Ldlr–/– mice transplanted with bone marrow from Cre+ mice (Treg AT); as a control (Con), the mice were injected with the Treg vehicle. Two weeks later, lesions were quantified for the indicated mRNA levels (n = 5) and for bead-labeled monocytes as above (n = 3). For all panels, *P < 0.05.
Figure 6
Figure 6. Evidence of a link between decreased TGF-β and increased MCP1 in lesions of WD-fed Ldlr–/– mice transplanted with bone marrow from Cre+ mice.
(A) LCM RT-qPCR analysis of Tgfb mRNA in RNA obtained from CD11chi, CD11clo, and sm-actin+ regions of atherosclerotic lesions of Cre and Cre+ mice (n = 5 mice per group). (B) ELISA-based measurement of latent TGF-β from extracts of atherosclerotic lesions of Cre and Cre+ mice (n = 5 mice per group). (C) Col1a1, Col3a1, and Egr1 mRNA in RNA obtained from sm-actin+ regions of atherosclerotic lesions of Cre and Cre+ mice (n = 5 mice per group). (D) Analysis of MCP1 mRNA expression in RNA obtained from the intima of atherosclerotic lesions of 10-week WD-fed Ldlr–/– mice treated with rat IgG (rIgG) or a neutralizing rat IgG antibody against TGF-β (TGF-β nAb) (100 μg per mouse) on days 1, 3, and 8 prior to sacrifice. The data were normalized to expression of Gapdh (n = 6 mice per group). For all panels, *P < 0.05. Symbols represent individual mice; horizontal bars indicate the mean.
Figure 7
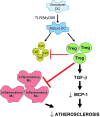
Figure 7. Schematic showing the mechanism of atheroprotective action of Tregs.
In atherosclerosis, mature DCs activate both Teff cells and Tregs. This study suggests that the atheroprotective effect of Tregs dominates. Tregs exert their atheroprotective action via suppression of Teff cells and inflammatory macrophages (Mϕs), and they suppress monocyte recruitment by decreasing MCP-1 production in a TGF-β–dependent manner.

Similar articles

Cited by

References

    1. Hansson GK, Hermansson A. The immune system in atherosclerosis. Nat Immunol. 2011;12(3):204–212. doi: 10.1038/ni.2001. - DOI - PubMed
    1. Members WG, et al. Heart Disease and Stroke Statistics—2012 Update. Circulation. 2012;125(1):e2–e220. doi: 10.1161/CIR.0b013e31823ac046. - DOI - PMC - PubMed
    1. Tacke F, et al. Monocyte subsets differentially employ CCR2, CCR5, and CX3CR1 to accumulate within atherosclerotic plaques. J Clin Invest. 2007;117(1):185–194. doi: 10.1172/JCI28549. - DOI - PMC - PubMed
    1. Trinchieri G. Interleukin-12: A proinflammatory cytokine with immunoregulatory functions that bridge innate resistance and antigen-specific adaptive immunity. Annu Rev Immunol. 1995;13:251–276. doi: 10.1146/annurev.iy.13.040195.001343. - DOI - PubMed
    1. Mallat Z, Taleb S, Ait-Oufella H, Tedgui A. The role of adaptive T cell immunity in atherosclerosis. J Lipid Res. 2009;50(suppl):S364–S369. doi: 10.1194/jlr.R800092-JLR200. - DOI - PMC - PubMed

Publication types

MeSH terms