. 2012 Dec 15;26(24):2763-79.
doi: 10.1101/gad.200113.112.

Genome-wide identification of enhancers in skeletal muscle: the role of MyoD1

Affiliations

Genome-wide identification of enhancers in skeletal muscle: the role of MyoD1

Roy Blum et al. Genes Dev. .

Abstract

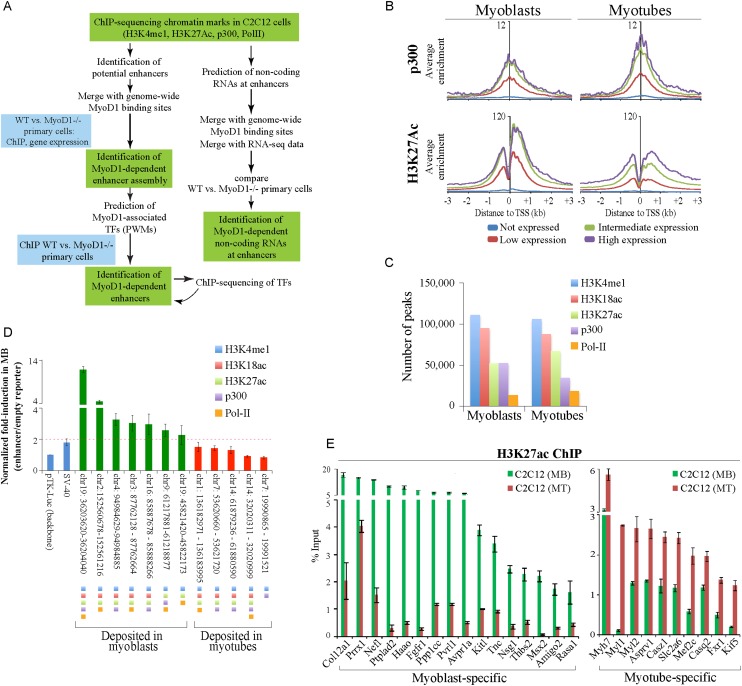
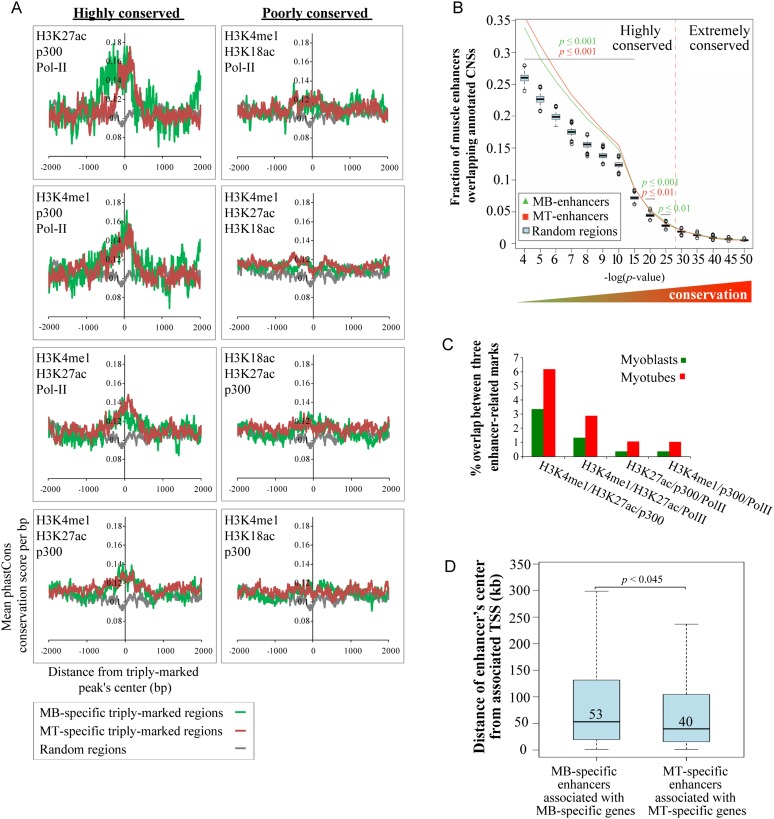
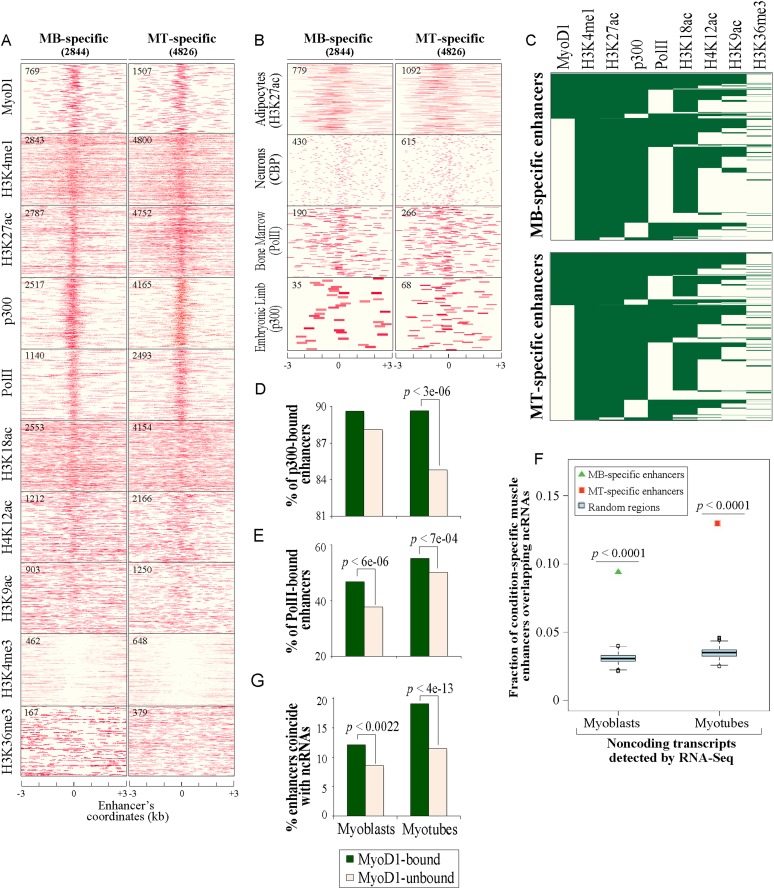
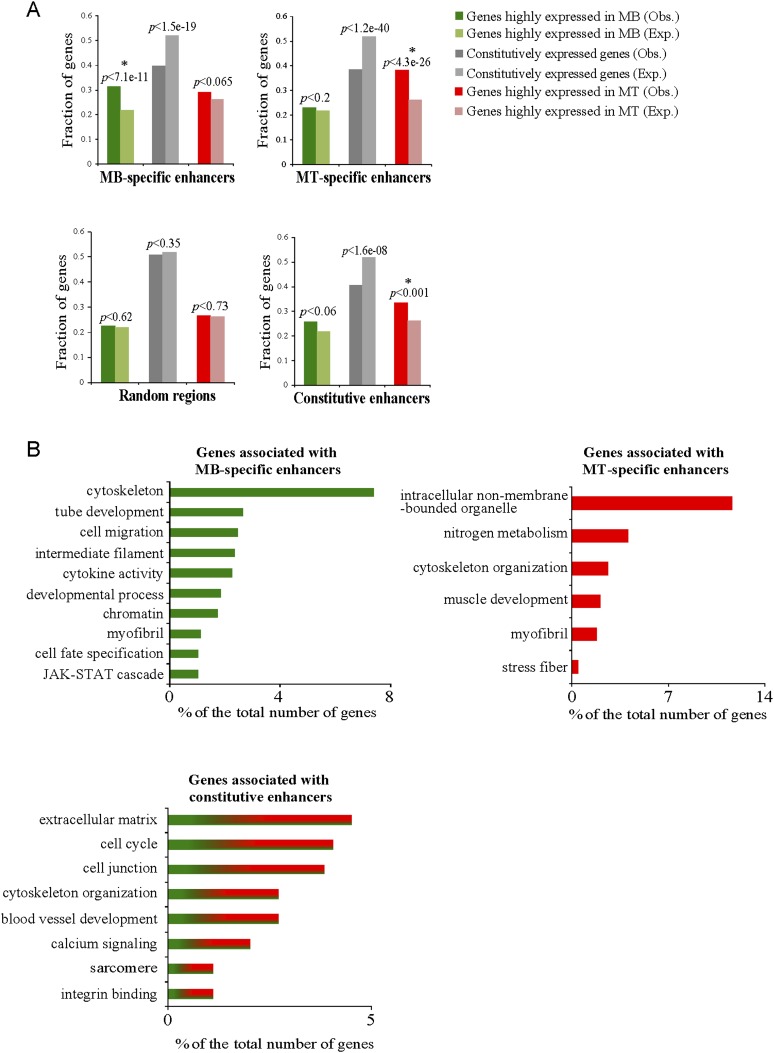
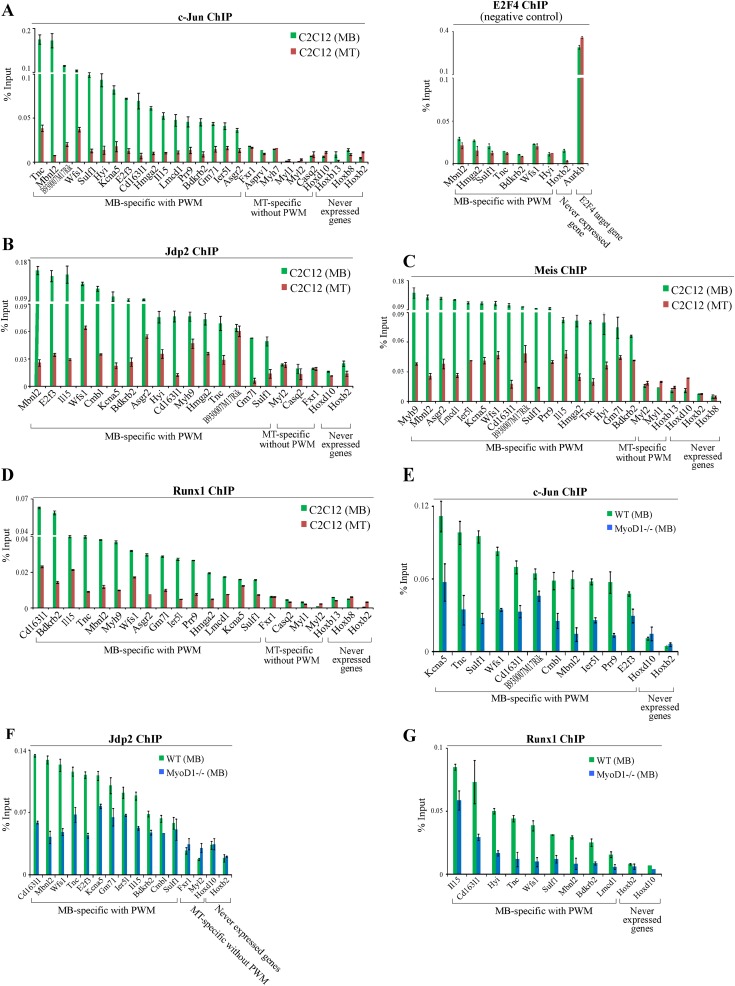
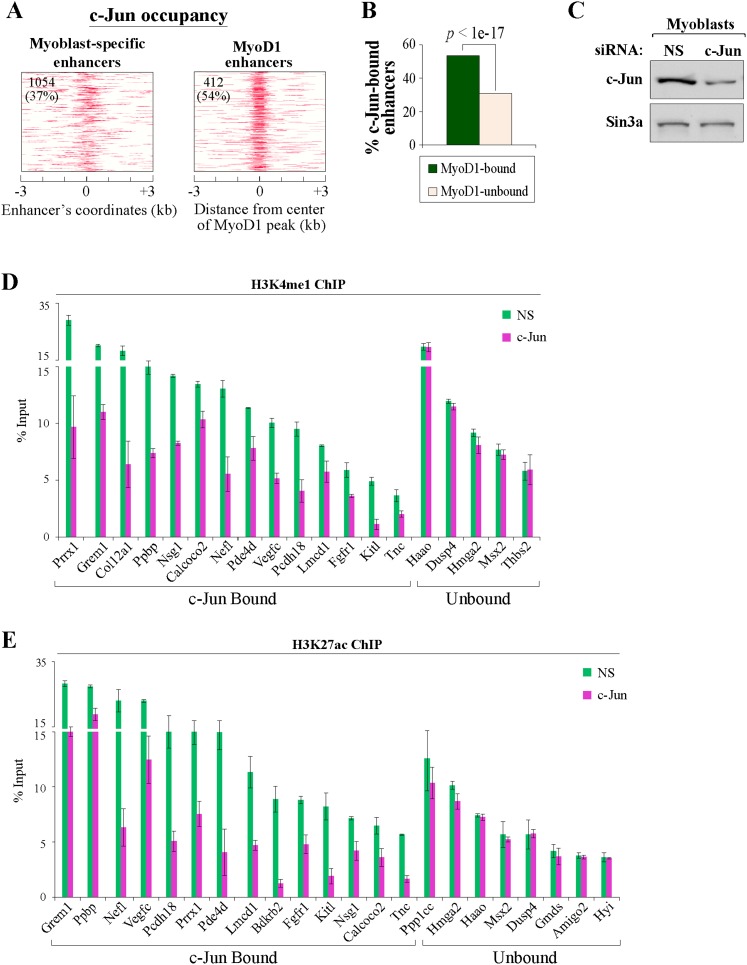
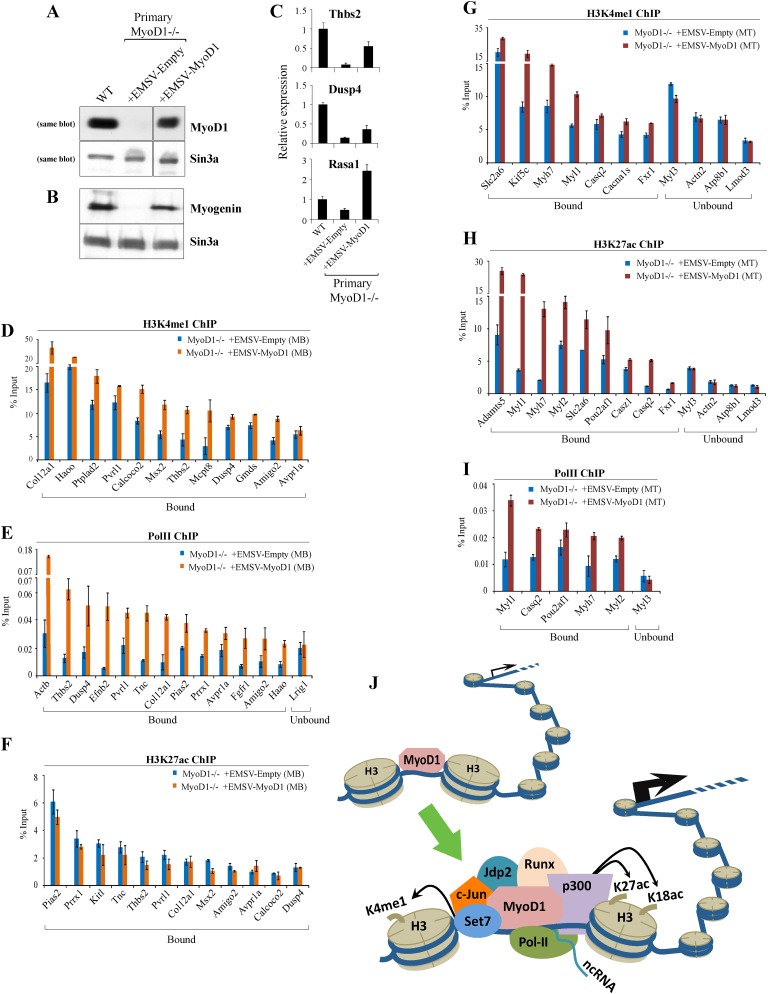
To identify the compendium of distal regulatory elements that govern myogenic differentiation, we generated chromatin state maps based on histone modifications and recruitment of factors that typify enhancers in myoblasts and myotubes. We found a striking concordance between the locations of these newly defined enhancers, MyoD1-binding events, and noncoding RNA transcripts. These enhancers recruit several sequence-specific transcription factors in a spatially constrained manner around MyoD1-binding sites. Remarkably, MyoD1-null myoblasts show a wholesale loss of recruitment of these factors as well as diminished monomethylation of H3K4 (H3K4me1) and acetylation of H3K27 (H3K27ac) and reduced recruitment of Set7, an H3K4 monomethylase. Surprisingly, we found that H3K4me1, but not H3K27ac, could be restored by re-expression of MyoD1 in MyoD1(-/-) myoblasts, although re-expression of this factor in MyoD1-null myotubes restored both histone modifications. Our studies identified a role for MyoD1 in condition-specific enhancer assembly through recruitment of transcription factors and histone-modifying enzymes that shape muscle differentiation.


Figures

Figure 1.
Figure 1.
Genome-wide identification of muscle enhancers. (A) Approach used to elucidate myogenic enhancers. (B) ChIP-seq analyses of p300 and H3K27ac indicate strong correlations with gene expression levels. The average ChIP-seq enrichment per 50-base-pair (bp) bin for the total population of genes in the four expression groups (see the Supplemental Material) was plotted with respect to the TSSs of coding genes. The Y-axis presents the average log2 enrichment value. (C) Distribution of enhancer-related peaks (triply marked) in myoblasts and myotubes. Peaks that satisfy the criteria for enhancer identification are depicted quantitatively as described in the Materials and Methods. (D) A series of putative enhancer regions were tested using a luciferase reporter assay. Genomic regions were marked by the indicated enhancer-related features. (E) qChIP was used to validate H3K27ac deposition at condition-specific enhancers associated with genes that were highly expressed in a condition-dependent manner. Enriched DNA was analyzed by quantitative PCR (qPCR). ChIP enrichment is shown as percent of input. Error bars depict the standard error of the mean (SEM) derived from three independent experiments. (MB) Myoblasts; (MT) myotubes.
Figure 2.
Figure 2.
Conservation and condition specificity of muscle enhancers. (A) The average phastCons conservation scores per base pair were plotted ±2 kb of the center of condition-specific triply marked peaks. The four most highly conserved and four least well-conserved groups are indicated as highly and poorly conserved, respectively. The panel of highly conserved groups refers to the following enriched combinations of marks: H3K4me1/H3K27ac/p300 (3442 and 5054), H3K4me1/H3K27ac/Pol II (1213 and 2219), H3K4me1/p300/Pol II (477 and 1051), and H3K27ac/p300/Pol II (333 and 932), where the indicated numbers of genomic fragments are shown parenthetically for myoblasts and myotubes, respectively. (B) Enrichment of myoblast and myotube enhancers at CNSs. A database of noncoding genomic human–rodent conserved sequences was intersected with myoblast or myotube enhancers or 1000 random sets of sequences of similar length and composition. The fractions of myoblast and myotube enhancers (green and red lines, respectively) and the respective distributions of control random sequences (cyan box plots) overlapping annotated CNSs are presented as a ranked series (shown from left to right) based on the increasing degree of CNS sequence conservation (where the smallest P-values indicate the most extreme degree of conservation). Muscle enhancers are associated with CNSs that are highly conserved (left end of the graph), but statistical significance is lost when they are compared with sets of extremely conserved CNSs (far right on the graph). (C) Coordinated accumulation of multiple marks at enhancers is higher in the differentiated state. Quantitation of triply marked enhancer-related peaks of the four most highly conserved groups. (D) Distributions of the median distance from the center of condition-specific enhancers to the TSS of their nearest associated condition-specific gene (Student's two-sample t-test).
Figure 3.
Figure 3.
Muscle enhancers are uniquely associated with spatially constrained chromatin marks. (A) Chromatin state maps of enhancer-related markers and several other histone marks within a region ±3 kb of the center of condition-specific enhancers. Data for MyoD1-binding events were obtained from Cao et al. (2010). p300- and H3K27ac-binding events (enriched tags) were identified using Qeseq (Supplemental Material). ChIP-seq data for p300 and H3K27ac were generated in this study, and all other data were published previously (Asp et al. 2011). The number of condition-specific enhancers significantly enriched with the indicated mark is indicated in the top left corner of each map. (B) Correspondence between muscle enhancers and enhancers in nonmuscle tissues. Enriched binding events of enhancer-related marks obtained from several nonmuscle mouse tissues (Visel et al. 2009; De Santa et al. 2010; Kim et al. 2010; Mikkelsen et al. 2010) corresponding to condition-specific muscle enhancers are plotted as indicated. (C) Clustering of MyoD1, enhancer features, and other histone marks based on their deposition at condition-specific muscle enhancers. (D,E) Recruitment of p300 and Pol II to MyoD1-bound enhancers. Recruitment of p300 (D) and Pol II (E) is significantly higher on enhancers bound by MyoD1 (two-proportion z-test). (F) Enrichment of condition-specific enhancers with transcribed ncRNAs deduced from RNA-seq (Trapnell et al. 2010). ncRNAs were overlapped with condition-specific enhancers or random data sets (Supplemental Material). The fractions of condition-specific enhancer and the respective distributions of random, control sequences (cyan box plots) overlapping ncRNAs are presented. (G) Coincidence of ncRNAs with enhancers is significantly higher on MyoD1-bound enhancers.
Figure 4.
Figure 4.
Correlation between assembly of condition-specific enhancers and levels of transcripts of associated protein-coding genes. (A) Condition-specific enhancers (top panel) and constitutive enhancers, along with random genomic regions (bottom panel), are shown. Observed (Obs) and expected (Exp) fractions for each group of genes (highly expressed in myoblasts, highly expressed in myotubes, and constitutively expressed) are shown together with their respective P-values, as calculated using a χ2 statistical test. Asterisks indicate statistical significance as compared with expected fractions (P-values <0.05). Expected fractions were calculated for each of the four examined data sets on the basis of the relative frequency of each group of associated genes (located at a distance ≤20 kb from a known TSS) with respect to all genes associated with the tested data set. Observed frequencies were determined by quantifying the entire list of genes represented by the microarray based on the three gene categories. (B) GO categories for genes associated (located at a distance ≤20 kb from a known TSS) with condition-specific and constitutive enhancers. GO categories with P-values <0.05 are shown.
Figure 5.
Figure 5.
MyoD1 loss results in reduced assembly of MyoD1-bound enhancers. (AD) qChIP was performed to detect enhancer-related marks—H3K4me1 (A), H3K27ac (B), Pol II (C), and p300 (D), as indicated—on MyoD1-bound myoblast-specific enhancers in primary MyoD1−/− and wild-type myoblasts. Several myoblast-specific enhancers not bound by MyoD1 were tested as negative controls and showed insignificant alterations in the levels of all marks tested. (E) RT-qPCR showing the effect of MyoD1 loss on a cohort of genes that are associated with MyoD1-bound, myoblast-specific enhancers. Data from wild-type and MyoD1−/− primary myoblasts are indicated. Relative expression of each gene is plotted with respect to primary wild-type myoblasts. (F) MyoD1 depletion significantly alters expression of ncRNAs transcribed across myoblast-specific enhancers. RNA was obtained from wild-type and MyoD1−/− primary myoblasts. Expression levels of ncRNAs coinciding with MyoD1-bound enhancers were measured by qPCR. As a control, we measured the expression levels of several other ncRNAs that coincide with enhancers that are not bound by MyoD1. (G) qChIP comparing Set7 recruitment with MyoD1-bound enhancers and enhancers that do not bind MyoD1. (H) Distributions of PWMs enriched in MyoD1-bound myoblast-specific enhancers. For each predicted binding motif, the accumulative number of matches per 1 bp was plotted across the region (±250 bp) surrounding the center of observed MyoD1-binding sites (Cao et al. 2010). Error bars for all qChIP and RT-qPCR data represent the standard error of the mean (SEM).
Figure 6.
Figure 6.
Condition-specific and MyoD1-dependent binding of transcription factors to MyoD1-bound enhancers. (AD) qChIP was performed to detect binding of c-Jun (A), Jdp2 (B), Meis (C), and Runx1 (D) in C2C12 myoblasts and myotubes. qChIP analysis using antibodies against E2F4 confirmed the specificity of our binding events. (EG) qChIP indicated that MyoD1 ablation results in reduced recruitment of c-Jun (E), Jdp2 (F), and Runx1 (G). We included several negative controls corresponding to myotube-specific enhancers that are not enriched for the predicted binding motif and genomic regions located upstream of genes that were never expressed.
Figure 7.
Figure 7.
c-Jun loss results in reduced assembly of c-Jun-bound enhancers. (A) Maps of myoblast-specific enhancers that bind MyoD1 and c-Jun within ±3 kb of the center of myoblast-specific enhancers. The number and percentage of condition-specific enhancers significantly enriched with c-Jun are indicated in the top left corner of each map. (B) Recruitment of c-Jun is significantly higher on MyoD1-bound enhancers. (C) Western blot detection of c-Jun in whole-cell extracts prepared from growing C2C12 myoblasts 48 h after transfection with an siRNA pool targeting c-Jun or with a control, nonsilencing siRNA (NS). (D,E) qChIP was performed to detect enhancer-related marks—H3K4me1 (D) and H3K27ac (E), as indicated—on myoblast-specific enhancers bound by c-Jun after treatment of myoblasts with c-Jun and control siRNAs. Several myoblast-specific enhancers not bound by c-Jun were tested as negative controls and showed insignificant alterations in the levels of all marks tested.
Figure 8.
Figure 8.
Exogenous MyoD1 expression restores enhancer assembly in primary MyoD1−/− myoblasts. (A) Western blot detection of MyoD1 in nuclear extracts prepared from growing wild-type, MyoD1−/−, and MyoD1−/− (rescued) primary myoblasts that stably express exogenous MyoD1. Sin3A is shown as a loading control. (B) Western blotting of nuclear extracts of confluent myoblasts indicates that myogenin expression is restored to levels comparable with those of wild-type cells. (C) RT-qPCR analysis of three target genes associated with myoblast-specific enhancers bound by MyoD1. We note that each of the promoters associated with these genes was devoid of MyoD1 binding. (DF) qChIP analysis was carried out to determine the impact of MyoD1 reconstitution in primary myoblasts on deposition of enhancer-related marks H3K4me1 (D), Pol II (E), and H3K27ac (F). (GI) qChIP analysis for H3K4me1 (G), H3K27ac (H), and Pol II (I) was performed to examine indicated marks on myotube-specific enhancers after MyoD1 expression. Error bars for all qChIP and RT-qPCR data represent standard error of the mean (SEM). (J) Model in which MyoD1 acts to assemble enhancers in muscle. Interactions between MyoD1 and other factors are essential for enhancer assembly and acquisition of a transcriptionally active state. See the text for details.

Similar articles

Cited by

References

    1. Asp P, Acosta-Alvear D, Tsikitis M, van Oevelen C, Dynlacht BD 2009. E2f3b plays an essential role in myogenic differentiation through isoform-specific gene regulation. Genes Dev 23: 37–53 - PMC - PubMed
    1. Asp P, Blum R, Vethantham V, Parisi F, Micsinai M, Cheng J, Bowman C, Kluger Y, Dynlacht BD 2011. Genome-wide remodeling of the epigenetic landscape during myogenic differentiation. Proc Natl Acad Sci 108: E149–E158 doi: 10.1073/pnas.1102223108 - PMC - PubMed
    1. Bengal E, Ransone L, Scharfmann R, Dwarki VJ, Tapscott SJ, Weintraub H, Verma IM 1992. Functional antagonism between c-Jun and MyoD proteins: A direct physical association. Cell 68: 507–519 - PubMed
    1. Blackwood EM, Kadonaga JT 1998. Going the distance: A current view of enhancer action. Science 281: 60–63 - PubMed
    1. Blais A, Tsikitis M, Acosta-Alvear D, Sharan R, Kluger Y, Dynlacht BD 2005. An initial blueprint for myogenic differentiation. Genes Dev 19: 553–569 - PMC - PubMed

Publication types

Substances