

Interferon-γ-induced activation of Signal Transducer and Activator of Transcription 1 (STAT1) up-regulates the tumor suppressing microRNA-29 family in melanoma cells
- PMID: 23245396
- PMCID: PMC3541122
- DOI: 10.1186/1478-811X-10-41
Interferon-γ-induced activation of Signal Transducer and Activator of Transcription 1 (STAT1) up-regulates the tumor suppressing microRNA-29 family in melanoma cells
Abstract
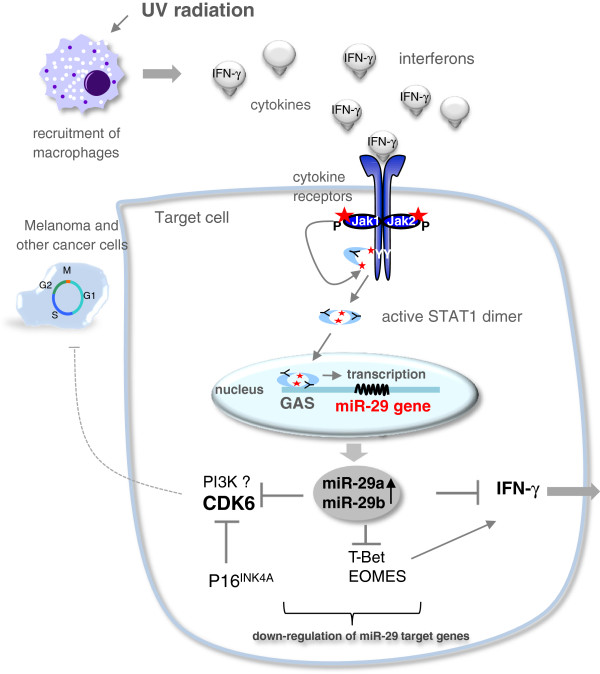
Background: The type-II-cytokine IFN-γ is a pivotal player in innate immune responses but also assumes functions in controlling tumor cell growth by orchestrating cellular responses against neoplastic cells. The role of IFN-γ in melanoma is not fully understood: it is a well-known growth inhibitor of melanoma cells in vitro. On the other hand, IFN-γ may also facilitate melanoma progression. While interferon-regulated genes encoding proteins have been intensively studied since decades, the contribution of miRNAs to effects mediated by interferons is an emerging area of research.We recently described a distinct and dynamic regulation of a whole panel of microRNAs (miRNAs) after IFN-γ-stimulation. The aim of this study was to analyze the transcriptional regulation of miR-29 family members in detail, identify potential interesting target genes and thus further elucidate a potential signaling pathway IFN-γ → Jak→ P-STAT1 → miR-29 → miR-29 target genes and its implication for melanoma growth.
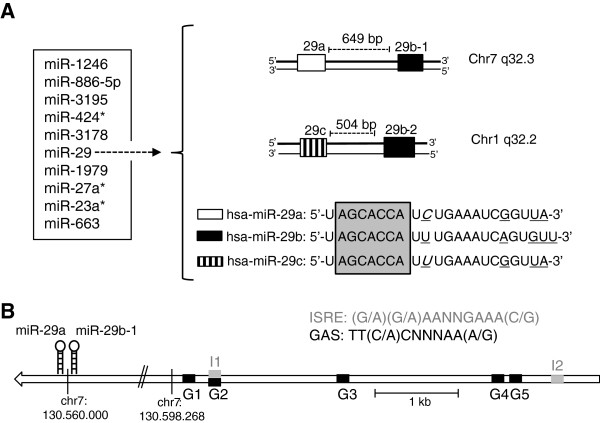
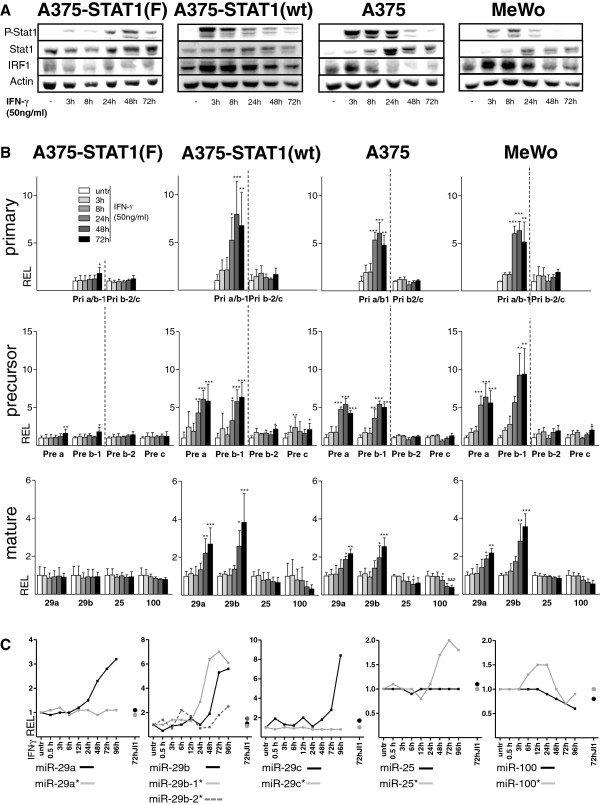
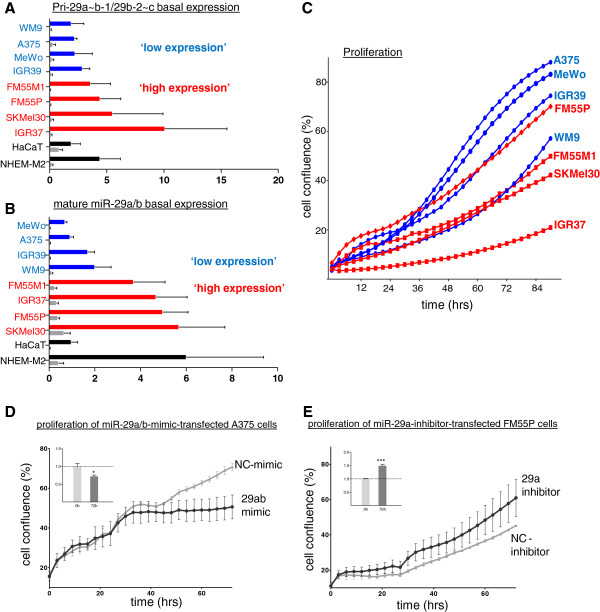
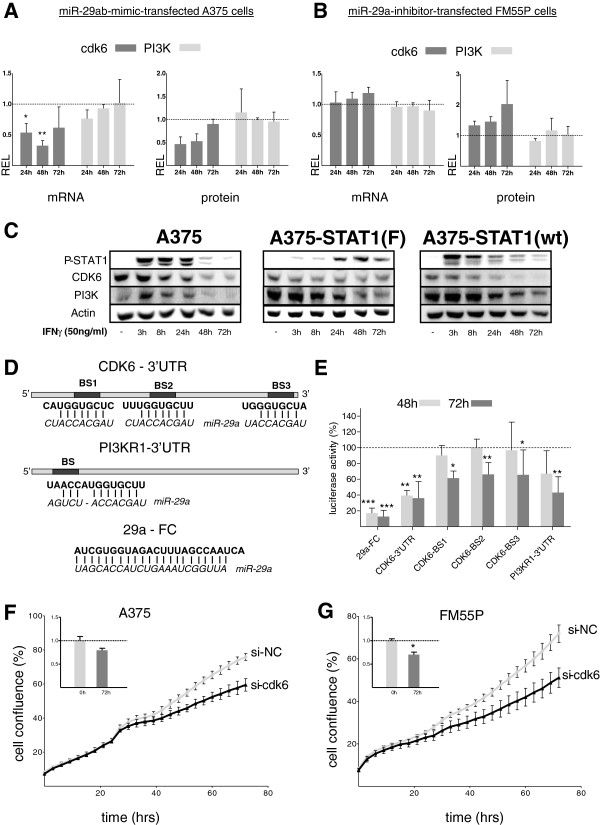
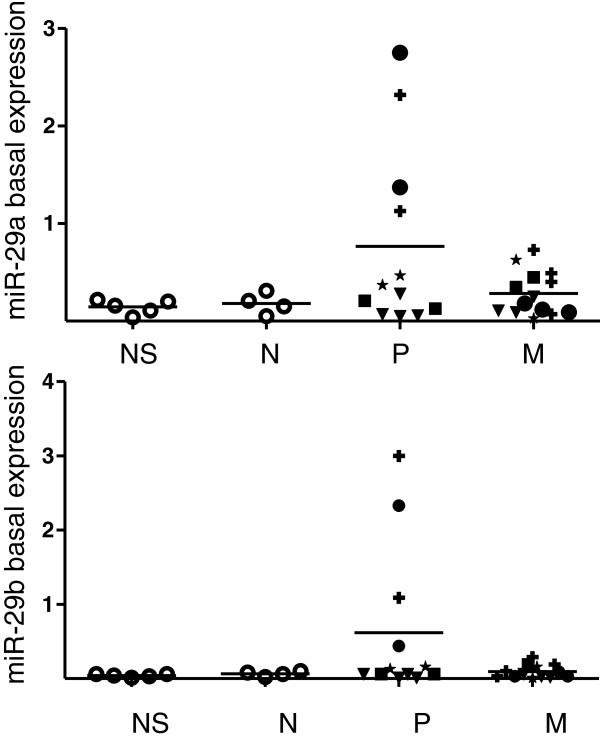
Results: Here we show that IFN-γ induces STAT1-dependently a profound up-regulation of the miR-29 primary cluster pri-29a~b-1 in melanoma cell lines. Furthermore, expression levels of pri-29a~b-1 and mature miR-29a and miR-29b were elevated while the pri-29b-2~c cluster was almost undetectable. We observed an inverse correlation between miR-29a/b expression and the proliferation rate of various melanoma cell lines. This finding could be corroborated in cells transfected with either miR-29 mimics or inhibitors. The IFN-γ-induced G1-arrest of melanoma cells involves down-regulation of CDK6, which we proved to be a direct target of miR-29 in these cells. Compared to nevi and normal skin, and metastatic melanoma samples, miR-29a and miR-29b levels were found strikingly elevated in certain patient samples derived from primary melanoma.
Conclusions: Our findings reveal that the miR-29a/b1 cluster is to be included in the group of IFN- and STAT-regulated genes. The up-regulated miR-29 family members may act as effectors of cytokine signalling in melanoma and other cancer cells as well as in the immune system.
Figures
Similar articles
-
Effect of microRNA-155 on the interferon-gamma signaling pathway in biliary atresia.Chin J Physiol. 2016 Dec 31;59(6):315-322. doi: 10.4077/CJP.2016.BAE419. Chin J Physiol. 2016. PMID: 27817193
-
Interferon-alpha-induced activation of signal transducer and activator of transcription proteins in malignant melanoma.Clin Cancer Res. 1998 Sep;4(9):2219-28. Clin Cancer Res. 1998. PMID: 9748142
-
IFN-γ-mediated IRF1/miR-29b feedback loop suppresses colorectal cancer cell growth and metastasis by repressing IGF1.Cancer Lett. 2015 Apr 1;359(1):136-47. doi: 10.1016/j.canlet.2015.01.003. Epub 2015 Jan 12. Cancer Lett. 2015. PMID: 25592039
-
Regulation of the MIR155 host gene in physiological and pathological processes.Gene. 2013 Dec 10;532(1):1-12. doi: 10.1016/j.gene.2012.12.009. Epub 2012 Dec 14. Gene. 2013. PMID: 23246696 Review.
-
A Positive Feedback Amplifier Circuit That Regulates Interferon (IFN)-Stimulated Gene Expression and Controls Type I and Type II IFN Responses.Front Immunol. 2018 May 28;9:1135. doi: 10.3389/fimmu.2018.01135. eCollection 2018. Front Immunol. 2018. PMID: 29892288 Free PMC article. Review.
Cited by
-
Intestinal Salmonella typhimurium infection leads to miR-29a induced caveolin 2 regulation.PLoS One. 2013 Jun 24;8(6):e67300. doi: 10.1371/journal.pone.0067300. Print 2013. PLoS One. 2013. PMID: 23826261 Free PMC article.
-
Decoding the Tumour Microenvironment: Molecular Players, Pathways, and Therapeutic Targets in Cancer Treatment.Cancers (Basel). 2024 Jan 31;16(3):626. doi: 10.3390/cancers16030626. Cancers (Basel). 2024. PMID: 38339377 Free PMC article. Review.
-
Analysis of lncRNA, miRNA, and mRNA Expression Profiling in Type I IFN and Type II IFN Overexpressed in Porcine Alveolar Macrophages.Int J Genomics. 2021 Jun 16;2021:6666160. doi: 10.1155/2021/6666160. eCollection 2021. Int J Genomics. 2021. PMID: 34222462 Free PMC article.
-
Trefoil Factor 3 Inhibits Thyroid Cancer Cell Progression Related to IL-6/JAK/STAT3 Signaling Pathway.Evid Based Complement Alternat Med. 2021 Sep 14;2021:2130229. doi: 10.1155/2021/2130229. eCollection 2021. Evid Based Complement Alternat Med. 2021. PMID: 34567204 Free PMC article.
-
Escape from IFN-γ-dependent immunosurveillance in tumorigenesis.J Biomed Sci. 2017 Feb 1;24(1):10. doi: 10.1186/s12929-017-0317-0. J Biomed Sci. 2017. PMID: 28143527 Free PMC article. Review.
References
-
- Krol J, Loedige I, Filipowicz W. The widespread regulation of microRNA biogenesis, function and decay. Nat Rev Genet. 2010;11:597–610. - PubMed
LinkOut - more resources
Full Text Sources
Molecular Biology Databases
Research Materials
Miscellaneous
