

Centrosomal localization of RhoGDIβ and its relevance to mitotic processes in cancer cells
- PMID: 23232495
- PMCID: PMC3583720
- DOI: 10.3892/ijo.2012.1730
Centrosomal localization of RhoGDIβ and its relevance to mitotic processes in cancer cells
Abstract
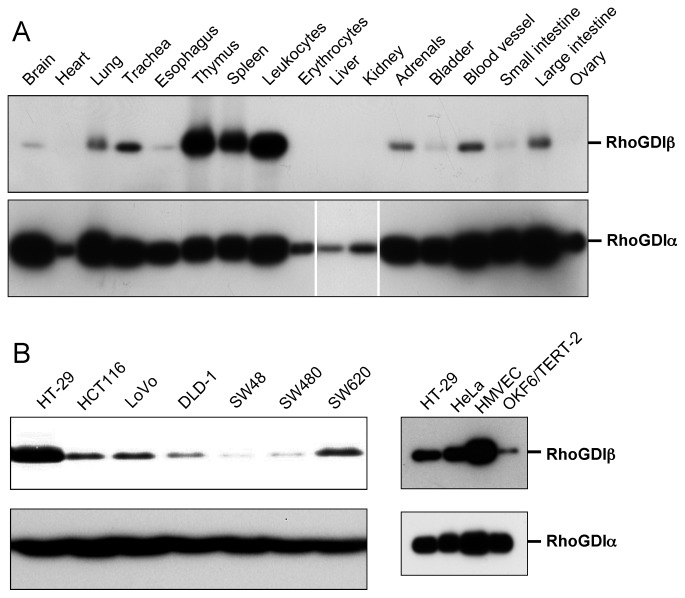
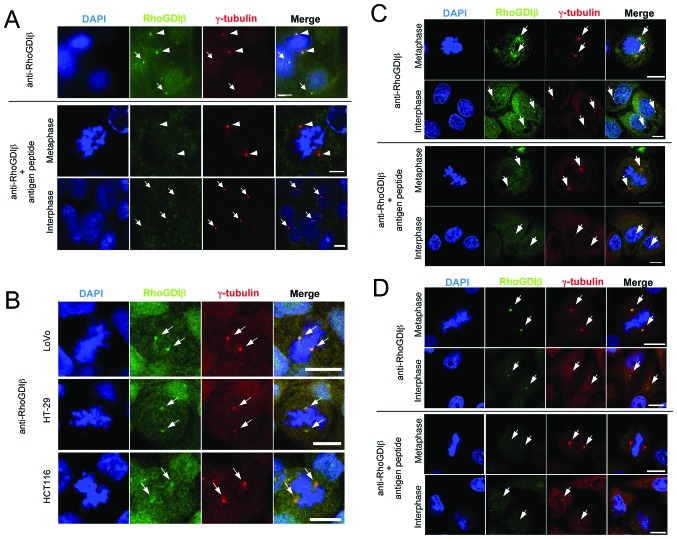
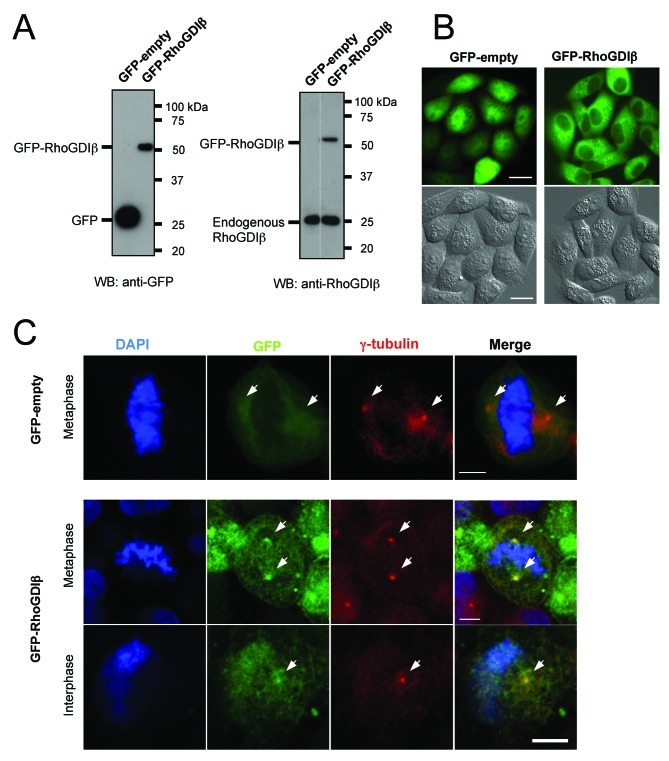
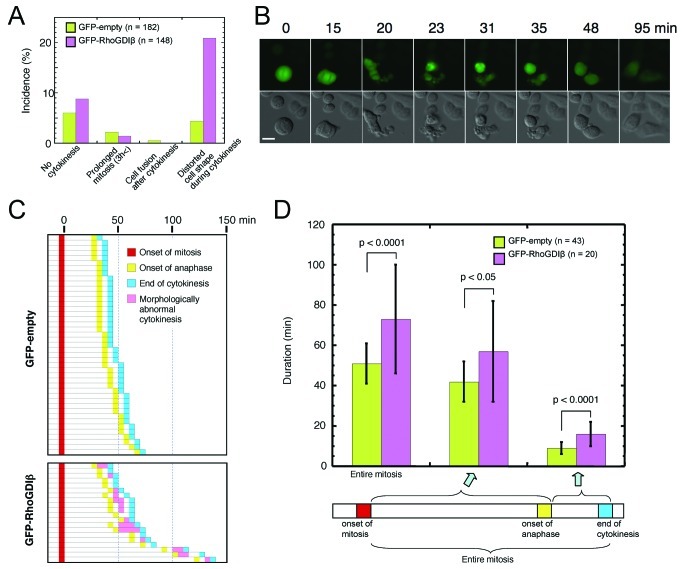
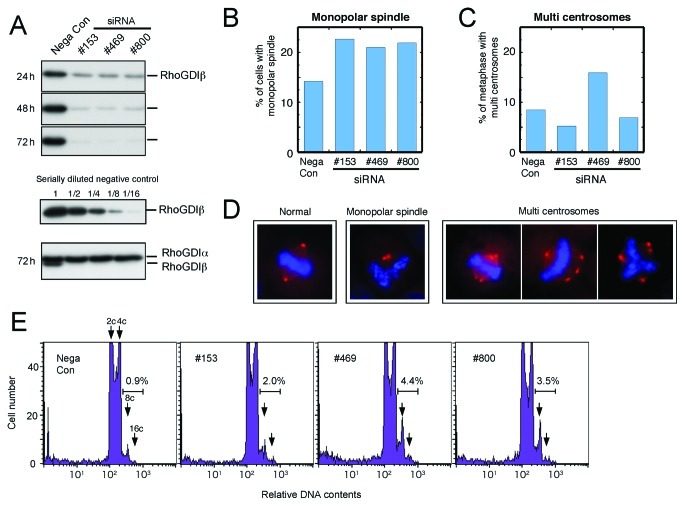
Rho GDP-dissociation inhibitors (RhoGDIs) are regulators of Rho family GTPases. RhoGDIβ has been implicated in cancer progression, but its precise role remains unclear. We determined the subcellular localization of RhoGDIβ and examined the effects of its overexpression and RNAi knockdown in cancer cells. Immunofluorescence staining showed that RhoGDIβ localized to centrosomes in human cancer cells. In HeLa cells, exogenous GFP-tagged RhoGDIβ localized to centrosomes and its overexpression caused prolonged mitosis and aberrant cytokinesis in which the cell shape was distorted. RNAi knockdown of RhoGDIβ led to increased incidence of monopolar spindle mitosis resulting in polyploid cells. These results suggest that RhoGDIβ has mitotic functions, including regulation of cytokinesis and bipolar spindle formation. The dysregulated expression of RhoGDIβ may contribute to cancer progression by disrupting these processes.
Figures
Similar articles
-
2-O-Octadecylascorbic acid represses RhoGDIβ expression and ameliorates DNA damage-induced abnormal spindle orientations.J Cell Biochem. 2021 Jul;122(7):739-751. doi: 10.1002/jcb.29908. Epub 2021 Feb 14. J Cell Biochem. 2021. PMID: 33586155
-
RhoGDIβ affects HeLa cell spindle orientation following UVC irradiation.J Cell Physiol. 2019 Sep;234(9):15134-15146. doi: 10.1002/jcp.28154. Epub 2019 Jan 16. J Cell Physiol. 2019. PMID: 30652309
-
RhoGDIβ promotes Sp1/MMP-2 expression and bladder cancer invasion through perturbing miR-200c-targeted JNK2 protein translation.Mol Oncol. 2017 Nov;11(11):1579-1594. doi: 10.1002/1878-0261.12132. Epub 2017 Sep 11. Mol Oncol. 2017. PMID: 28846829 Free PMC article.
-
Spindle pole body duplication: a model for centrosome duplication?Trends Cell Biol. 2000 Aug;10(8):329-35. doi: 10.1016/s0962-8924(00)01798-0. Trends Cell Biol. 2000. PMID: 10884685 Review.
-
The role of mitotic kinases in coupling the centrosome cycle with the assembly of the mitotic spindle.J Cell Sci. 2014 Oct 1;127(Pt 19):4111-22. doi: 10.1242/jcs.151753. Epub 2014 Aug 15. J Cell Sci. 2014. PMID: 25128564 Review.
Cited by
-
Rho GTPases as regulators of mitosis and cytokinesis in mammalian cells.Small GTPases. 2014;5:e29770. doi: 10.4161/sgtp.29770. Epub 2014 Jul 2. Small GTPases. 2014. PMID: 24988197 Free PMC article. Review.
-
Positive regulation of Rho GTPase activity by RhoGDIs as a result of their direct interaction with GAPs.BMC Syst Biol. 2015 Jan 28;9:3. doi: 10.1186/s12918-015-0143-5. BMC Syst Biol. 2015. PMID: 25628036 Free PMC article.
-
Apoptosis‑independent cleavage of RhoGDIβ at Asp19 during PMA‑stimulated differentiation of THP‑1 cells to macrophages.Mol Med Rep. 2017 Apr;15(4):1722-1726. doi: 10.3892/mmr.2017.6199. Epub 2017 Feb 13. Mol Med Rep. 2017. PMID: 28260067 Free PMC article.
-
Controlling the switches: Rho GTPase regulation during animal cell mitosis.Cell Signal. 2014 Dec;26(12):2998-3006. doi: 10.1016/j.cellsig.2014.09.022. Epub 2014 Oct 5. Cell Signal. 2014. PMID: 25286227 Free PMC article. Review.
-
The Dual Function of RhoGDI2 in Immunity and Cancer.Int J Mol Sci. 2023 Feb 16;24(4):4015. doi: 10.3390/ijms24044015. Int J Mol Sci. 2023. PMID: 36835422 Free PMC article. Review.
References
-
- Etienne-Manneville S, Hall A. Rho GTPases in cell biology. Nature. 2002;420:629–635. - PubMed
-
- Wennerberg K, Der CJ. Rho-family GTPases: it’s not only Rac and Rho (and I like it) J Cell Sci. 2004;117:1301–1312. - PubMed
-
- Rossman KL, Der CJ, Sondek J. GEF means go: turning on RHO GTPases with guanine nucleotide-exchange factors. Nat Rev Mol Cell Biol. 2005;6:167–180. - PubMed
-
- Tcherkezian J, Lamarche-Vane N. Current knowledge of the large RhoGAP family of proteins. Biol Cell. 2007;99:67–86. - PubMed
Publication types
MeSH terms
Substances
LinkOut - more resources
Full Text Sources
