Comparative Study
. 2013 Feb;33(4):773-84.
doi: 10.1128/MCB.00916-12. Epub 2012 Dec 10.

Comparison of genome-wide binding of MyoD in normal human myogenic cells and rhabdomyosarcomas identifies regional and local suppression of promyogenic transcription factors

Affiliations
Comparative Study

Comparison of genome-wide binding of MyoD in normal human myogenic cells and rhabdomyosarcomas identifies regional and local suppression of promyogenic transcription factors

Kyle L MacQuarrie et al. Mol Cell Biol. 2013 Feb.

Abstract

Rhabdomyosarcoma is a pediatric tumor of skeletal muscle that expresses the myogenic basic helix-loop-helix protein MyoD but fails to undergo terminal differentiation. Prior work has determined that DNA binding by MyoD occurs in the tumor cells, but myogenic targets fail to activate. Using MyoD chromatin immunoprecipitation coupled to high-throughput sequencing and gene expression analysis in both primary human muscle cells and RD rhabdomyosarcoma cells, we demonstrate that MyoD binds in a similar genome-wide pattern in both tumor and normal cells but binds poorly at a subset of myogenic genes that fail to activate in the tumor cells. Binding differences are found both across genomic regions and locally at specific sites that are associated with binding motifs for RUNX1, MEF2C, JDP2, and NFIC. These factors are expressed at lower levels in RD cells than muscle cells and rescue myogenesis when expressed in RD cells. MEF2C is located in a genomic region that exhibits poor MyoD binding in RD cells, whereas JDP2 exhibits local DNA hypermethylation in its promoter in both RD cells and primary tumor samples. These results demonstrate that regional and local silencing of differentiation factors contributes to the differentiation defect in rhabdomyosarcomas.


Figures

Fig 1
Fig 1
Characteristics of MyoD binding in primary human myoblasts and myotubes. (A) A comparison of the top 30,000 (30K) MyoD peaks in myoblasts and myotubes demonstrates a high proportion of overlap in the sites occupied by MyoD, regardless of differentiation status. Peaks were ranked by P value and grouped into bins that increase by 3,000 peaks each time (i.e., first the 3,000 most significant peaks are considered, then the 6,000 most significant are considered, etc.). The overlap fraction scale is indicated. (B) Scatterplots showing the square root of the height of MyoD peaks within 2 kb of the TSS of the genes that either increase or decrease with myogenic differentiation (as indicated above the panels) demonstrate that upregulated genes are associated with increasing peaks and that the converse is true for downregulated genes. Differential peaks are colored blue if increased during differentiation and colored gold if decreased, and the number (n) and P value (p) are indicated in the appropriate corner. P-value statistics are calculated on the basis of the enrichment of differential peaks associated with the given gene set out of all differential peaks present within 2 kb up- or downstream of promoters based on a hypergeometric distribution (see Materials and Methods). (C) Myotube-specific MyoD peaks were compared to myoblast-specific MyoD peaks, and a de novo motif analysis was performed on the DNA immediately surrounding (100 bp up- or downstream) the peaks to determine over- and underrepresented DNA motifs. Positive scores indicate those motifs that are associated with MyoD binding in myotubes, while negative scores indicate those that are associated with MyoD in myoblasts. Motifs were compared to those in a transcription factor database to determine the closest annotated match. ratio, enriched/depleted ratio of motifs; fg.frac and bg.frac, fractions of foreground and background sequences that contain at least one motif occurrence, respectively.
Fig 2
Fig 2
The DNA binding characteristics of MyoD in RD rhabdomyosarcoma cells resemble MyoD binding in primary human myotubes. (A) As in Fig. 1A, the top 30,000 MyoD peaks were compared between primary human cells and RD cells. Peaks were ranked by P value and grouped into bins that increase by 3,000 peaks each time (i.e., first the 3,000 most significant peaks are considered, then the 6,000 most significant are considered, etc.). While MyoD peaks in RD cells overlap to a substantial degree with those in both myoblasts and myotubes, the overlap is higher with the RD/myotube comparison. The overlap fraction scale is indicated. (B) Scatterplots show a relatively equal distribution of the square root of the MyoD peak heights of all peaks found in myotubes, myoblasts, and RD cells. (C) Histograms of the proportion of E boxes bound by MyoD in myoblasts, myotubes, and RD cells, grouped by the central dinucleotide core of the E-box sequence, show no difference in sequence preference, apart from an increase in CC E boxes in RD cells.
Fig 3
Fig 3
MyoD binding in RD cells is impaired relative to that in human myotubes at genes that are poorly expressed in RD cells. (A) Scatterplots of gene expression determined by expression microarrays comparing either myotube gene expression to myoblast expression or myotube gene expression to RD cell gene expression. Genes are given the following colors on the basis of their categories: blue, genes that normally have increased expression during myogenesis but are expressed at a substantially lower level in RD cells; cyan, genes that normally have increased expression during myogenesis and are expressed at comparable levels between RD and primary cells; red, genes that normally decrease expression during myogenesis and continue to be expressed in RD cells; green, genes that normally decrease during myogenesis and also are expressed at low levels in RD cells. See below for definitions of MT > RD and MT ∼ RD. (B) A screenshot from the UCSC genome browser shows a region that has low MyoD ChIP-seq peaks in primary cells but substantial peaks in RD cells and that agrees with HSS data from human myoblasts. Track identity is indicated along the side (HSMM is the ENCODE human myoblast data, and H7-hESC is from human embryonic stem cells). The scale of peak heights is indicated along the left for each track, and the scale and genomic coordinates are indicated below. (C) There is a positive association between cell type-specific regional increases in MyoD ChIP-seq peak heights and expression of genes in those regions. The scatterplot of gene expression is as described for panel A, but with genes colored on the basis of their association with regional changes in MyoD ChIP-seq: blue dots, genes physically located (defined as either some portion of a transcript itself or 5 kb up- or downstream from either end of a transcript overlapping with the region) in regions determined to have higher MyoD peaks in myotubes; red dots, genes in regions with higher MyoD peaks in RD cells. (D) Scatterplots of MyoD peak height associated with genes significantly upregulated during myogenic differentiation in the primary cells, further grouped on the basis of gene expression, as indicated by gene category. All, all upregulated genes are plotted; MT > RD, the plot contains only those genes that are expressed at levels at least 3 times higher in myotubes (MT) than RD cells; MT ∼ RD, plots of those genes expressed comparably (expression within 50%) between myotubes and RD cells. Similar to Fig. 1B, the x and y axes correspond to the square root of peak heights in two cell types. Increased peaks along the y axis (myotubes) relative to the x axis (RD cells) are colored blue, and decreased peaks are colored gold. Numbers (n) and P values (p) for enrichment of differential peaks are indicated in the appropriate corner. See Materials and Methods for the definition of differential peaks and calculation of the enrichment P value. The myotube/RD cell comparison shows an enrichment for higher MyoD peaks in myotubes only at genes that are poorly expressed in RD cells (MT > RD plot) and not at those expressed at comparable levels in myotubes and RD cells (MT ∼ RD plot).
Fig 4
Fig 4
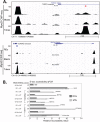
Differential MyoD binding in RD cells and myotubes is due to regional and local differences in chromatin accessibility. (A) UCSC genome browser screenshots of local MyoD binding differences between RD cells and myotubes at peaks located in the region of two of the genes tested for accessibility differences. Track identity is indicated along the side. The scale of peak heights is indicated along the left for each track, and the scale and genomic coordinates are indicated below. Individual differential peaks are indicated with an asterisk. (B) PvuII endonuclease accessibility was assessed in RD cells and human primary myotubes at several loci with regional (rows C to F) or local (rows G to J) differences (Δ) in MyoD binding patterns. The genes located closest to the tested loci are indicated at the end of the bars. The status of MyoD binding, as determined by ChIP-seq, is indicated in the left-hand column. Locus G corresponds to the area indicated by the red asterisk in the top of panel A, and locus H corresponds to the blue asterisk in the bottom of panel A. Locus I is approximately 5 kb from locus H in an area with no MyoD binding. Relative accessibility was determined by qPCR and calculated compared to the control locus (A), a GC E box ∼5 kb upstream of the HBB gene. Data are represented as the means ± standard deviations of two technical replicates. Genomic coordinates and PCR primers for each locus are listed in Materials and Methods. Ø, not present.
Fig 5
Fig 5
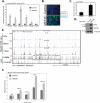
A genome-wide comparison of differential MyoD binding between myotubes and RD cells identifies binding motifs for promyogenic transcription factors enriched at MyoD-bound sites in myotubes. (A) A de novo motif analysis performed as described in the legend to Fig. 1C to determine motifs enriched adjacent to either myotube- or RD cell-specific MyoD peaks. Scores and motif matches were determined as described in the legend to Fig. 1C. (B) RT-PCR for RUNX1, JDP2, NFIC, and MEF2C transcripts, as indicated, in either RD cells (72 h in differentiation medium) or primary human myotubes (MT; 72 h in differentiation medium). TIMM17b RT-PCR serves as the internal control. (C) Immunostains of RD cells infected with an empty retrovirus or a retrovirus expressing either JDP2 or NFIC and put in low-serum differentiation medium for 72 h. MHC is a marker of terminal myogenic differentiation, and DAPI was used to stain all nuclei. (D) qPCR for muscle-specific creatine kinase, a marker of terminal myogenic differentiation on RD cells treated as described for panel C. (E) Western blots (WB) on whole-cell lysates (WCL) from RD cells treated as described for panel C, as indicated along the top of the panels. The protein blotted for is indicated to the right of each panel, and protein size is indicated along the left. (F) Cell counts indicating the percentage of RD cells that, after 24 h in differentiation medium, incorporated EdU during a 24-h pulse. For qPCR, minus reverse transcriptase controls were monitored for the absence of product, and TIMM17b served as the internal control. Both the qPCR and EdU data are reported as the means ± SEMs of three independent biological replicates. **, P < 0.01; ***, P < 0.001.
Fig 6
Fig 6
MEF2C acts at myogenic targets in RD cells to rescue expression and myogenesis and is located in a genomic region with low levels of MyoD binding in RD cells. (A) qPCR for potential MEF2C/MyoD targets. The subset of MT > RD genes from Fig. 3D was restricted to those genes with higher MyoD peaks in myotubes (blue dots), ranked on the basis of MEF2C PWM scores, and then the top six genes were chosen for qPCR analysis. All qPCRs were performed on three independent biological samples of RD cells transduced with either an empty control retrovirus or one expressing an Mef2C isoform and placed in differentiation medium for 36 h. The qPCR data are reported as the means ± SEMs of the three replicates, and TIMM17b served as the internal control. (B) Immunostains of RD cells treated as described for panel A. MHC is a marker of myogenesis, and DAPI stains all cell nuclei. (C) qPCR for muscle-specific creatine kinase in RD cells treated as described for panel A. The qPCR data are reported as the means ± SEMs of the three replicates, and TIMM17b served as the internal control. (D) Western blots on whole-cell lysates from RD cells treated as described for panel A and immunoblotted for the proteins indicated along the right. (E) A screenshot from the UCSC genome browser shows that MEF2C is in a genomic region that has low MyoD ChIP-seq peaks compared to primary myoblasts and myotubes. Track identity is indicated along the side. HSS indicates hypersensitivity data (HSMM is ENCODE human myoblast data, and H7-hESC is from human embryonic stem cells). The scale of peak heights is indicated along the left for each track, and the scale and genomic coordinates are indicated below. (F) RD cells expressing MEF2C have increased MyoD binding at a subset of E boxes located near MEF2 binding sites. MyoD ChIP was performed in RD cells transduced with control virus or after differentiation with MEF2C retrovirus. Relative enrichment for each locus was determined by qPCR and normalized to the control locus (A). Data are indicated as the means ± standard deviations of two technical replicates. The genes located closest to the tested loci are indicated at the top of the bars. *, P < 0.05; **, P < 0.01.
Fig 7
Fig 7
The RD cell line and primary RMS tumors are DNA hypermethylated in the promoter region of the promyogenic factor JDP2. RRBS data from the promoter region of JDP2 for 13 primary tumors (for diagnostic details, see Table S8 in the supplemental material), RD cells, primary myotubes (MTs), and two different samples of normal adult skeletal muscle (Adult Sk Muscle). Higher levels of methylation at a given genomic position are indicated by darker coloration, as indicated in the key. JDP2 TSS indicates the position of the transcription start site of the gene, and the annotated CpG island at the JDP2 promoter is also indicated (also see Fig. S2 in the supplemental material). Genomic distances are indicated at the bottom.

Similar articles

Cited by

References

    1. Cao Y, Yao Z, Sarkar D, Lawrence M, Sanchez GJ, Parker MH, MacQuarrie KL, Davison J, Morgan MT, Ruzzo WL, Gentleman RC, Tapscott SJ. 2010. Genome-wide MyoD binding in skeletal muscle cells: a potential for broad cellular reprogramming. Dev. Cell 18:662–674 - PMC - PubMed
    1. Lassar AB, Buskin JN, Lockshon D, Davis RL, Apone S, Hauschka SD, Weintraub H. 1989. MyoD is a sequence-specific DNA binding protein requiring a region of myc homology to bind to the muscle creatine kinase enhancer. Cell 58:823–831 - PubMed
    1. Murre C, McCaw PS, Baltimore D. 1989. A new DNA binding and dimerization motif in immunoglobulin enhancer binding, daughterless, MyoD, and myc proteins. Cell 56:777–783 - PubMed
    1. Lassar AB, Davis RL, Wright WE, Kadesch T, Murre C, Voronova A, Baltimore D, Weintraub H. 1991. Functional activity of myogenic HLH proteins requires hetero-oligomerization with E12/E47-like proteins in vivo. Cell 66:305–315 - PubMed
    1. Merlino G, Helman L. 1999. Rhabdomyosarcoma—working out the pathways. Oncogene 18:5340–5348 - PubMed

Publication types