Integrative annotation of chromatin elements from ENCODE data
- PMID: 23221638
- PMCID: PMC3553955
- DOI: 10.1093/nar/gks1284
Integrative annotation of chromatin elements from ENCODE data
Abstract
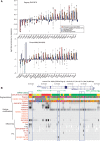
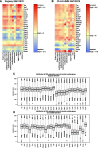
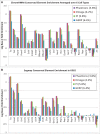
The ENCODE Project has generated a wealth of experimental information mapping diverse chromatin properties in several human cell lines. Although each such data track is independently informative toward the annotation of regulatory elements, their interrelations contain much richer information for the systematic annotation of regulatory elements. To uncover these interrelations and to generate an interpretable summary of the massive datasets of the ENCODE Project, we apply unsupervised learning methodologies, converting dozens of chromatin datasets into discrete annotation maps of regulatory regions and other chromatin elements across the human genome. These methods rediscover and summarize diverse aspects of chromatin architecture, elucidate the interplay between chromatin activity and RNA transcription, and reveal that a large proportion of the genome lies in a quiescent state, even across multiple cell types. The resulting annotation of non-coding regulatory elements correlate strongly with mammalian evolutionary constraint, and provide an unbiased approach for evaluating metrics of evolutionary constraint in human. Lastly, we use the regulatory annotations to revisit previously uncharacterized disease-associated loci, resulting in focused, testable hypotheses through the lens of the chromatin landscape.
Figures


Similar articles
-
A cis-regulatory map of the Drosophila genome.Nature. 2011 Mar 24;471(7339):527-31. doi: 10.1038/nature09990. Nature. 2011. PMID: 21430782 Free PMC article.
-
Integrative analysis of public ChIP-seq experiments reveals a complex multi-cell regulatory landscape.Nucleic Acids Res. 2015 Feb 27;43(4):e27. doi: 10.1093/nar/gku1280. Epub 2014 Dec 3. Nucleic Acids Res. 2015. PMID: 25477382 Free PMC article.
-
Spectacle: fast chromatin state annotation using spectral learning.Genome Biol. 2015 Feb 12;16(1):33. doi: 10.1186/s13059-015-0598-0. Genome Biol. 2015. PMID: 25786205 Free PMC article.
-
A brief review on the Human Encyclopedia of DNA Elements (ENCODE) project.Genomics Proteomics Bioinformatics. 2013 Jun;11(3):135-41. doi: 10.1016/j.gpb.2013.05.001. Epub 2013 May 28. Genomics Proteomics Bioinformatics. 2013. PMID: 23722115 Free PMC article. Review.
-
Functional annotation of the animal genomes: An integrated annotation resource for the horse.PLoS Genet. 2023 Mar 2;19(3):e1010468. doi: 10.1371/journal.pgen.1010468. eCollection 2023 Mar. PLoS Genet. 2023. PMID: 36862752 Free PMC article. Review.
Cited by
-
Deciphering the genetics and mechanisms of predisposition to multiple myeloma.Nat Commun. 2024 Aug 5;15(1):6644. doi: 10.1038/s41467-024-50932-7. Nat Commun. 2024. PMID: 39103364 Free PMC article.
-
PAtCh-Cap: input strategy for improving analysis of ChIP-exo data sets and beyond.Nucleic Acids Res. 2016 Dec 1;44(21):e159. doi: 10.1093/nar/gkw741. Epub 2016 Aug 22. Nucleic Acids Res. 2016. PMID: 27550178 Free PMC article.
-
Interspecies regulatory landscapes and elements revealed by novel joint systematic integration of human and mouse blood cell epigenomes.Genome Res. 2024 Aug 20;34(7):1089-1105. doi: 10.1101/gr.277950.123. Genome Res. 2024. PMID: 38951027 Free PMC article.
-
Genome-scale high-resolution mapping of activating and repressive nucleotides in regulatory regions.Nat Biotechnol. 2016 Nov;34(11):1180-1190. doi: 10.1038/nbt.3678. Epub 2016 Oct 3. Nat Biotechnol. 2016. PMID: 27701403 Free PMC article.
-
High-resolution characterization of sequence signatures due to non-random cleavage of cell-free DNA.BMC Med Genomics. 2015 Jun 17;8:29. doi: 10.1186/s12920-015-0107-z. BMC Med Genomics. 2015. PMID: 26081108 Free PMC article.
References
Publication types
MeSH terms
Substances
Grants and funding
LinkOut - more resources
Full Text Sources
Other Literature Sources
Molecular Biology Databases

