. 2013 Feb;87(4):1926-36.
doi: 10.1128/JVI.02903-12. Epub 2012 Dec 5.

A hydrogen peroxide-inactivated virus vaccine elicits humoral and cellular immunity and protects against lethal West Nile virus infection in aged mice

Affiliations

A hydrogen peroxide-inactivated virus vaccine elicits humoral and cellular immunity and protects against lethal West Nile virus infection in aged mice

Amelia K Pinto et al. J Virol. 2013 Feb.

Abstract

West Nile virus (WNV) is an emerging pathogen that is now the leading cause of mosquito-borne and epidemic encephalitis in the United States. In humans, a small percentage of infected individuals develop severe neuroinvasive disease, with the greatest relative risk being in the elderly and immunocompromised, two populations that are difficult to immunize effectively with vaccines. While inactivated and subunit-based veterinary vaccines against WNV exist, currently there is no vaccine or therapy available to prevent or treat human disease. Here, we describe the generation and preclinical efficacy of a hydrogen peroxide (H(2)O(2))-inactivated WNV Kunjin strain (WNV-KUNV) vaccine as a candidate for further development. Both young and aged mice vaccinated with H(2)O(2)-inactivated WNV-KUNV produced robust adaptive B and T cell immune responses and were protected against stringent and lethal intracranial challenge with a heterologous virulent North American WNV strain. Our studies suggest that the H(2)O(2)-inactivated WNV-KUNV vaccine is safe and immunogenic and may be suitable for protection against WNV infection in vulnerable populations.


Figures
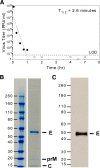
Fig 1
Fig 1
Inactivation and characterization of an H2O2-WNV-KUNV vaccine. (A) A representative purified preparation of WNV-KUNV (20 mM Tris-HCl [pH 8.0], 50 mM NaCl, 2% sorbitol) was inactivated with 3.0% H2O2 at room temperature (25 ± 2°C) for 7 h. Aliquots of the suspension were removed at the indicated time points and treated with catalase to neutralize residual H2O2 prior to measuring infectious virus titers by plaque assay. The calculated half-life (T1/2) for inactivation is shown. The limit of detection (LOD) is indicated by the dashed line. Empty symbols below the limit of detection indicate that no viable virus was detected by plaque assay at those time points. The data shown are representative of at least three independent experiments. (B) Following purification, 0.1 μg of representative vaccine antigen was loaded onto a reducing SDS-polyacrylamide gel and protein bands were visualized by Coomassie stain. Bands corresponding to the molecular sizes of E, prM, and C are denoted. (C) The same vaccine antigen described above was analyzed by SDS-PAGE under nonreducing conditions and probed by Western blotting with the anti-WNV E-protein-specific MAb 7G11. Note that the differences in molecular sizes of E in panels B and C reflect the presence or absence of a reducing agent, respectively, during SDS-PAGE. The numbers to the left of the gels in panels B and C are molecular masses (in kilodaltons).
Fig 2
Fig 2
Humoral response after vaccination with H2O2-WNV-KUNV in C57BL/6 and BALB/c mice. (A) Neutralization titers (NT50) against WNV-NY from serum on days 28 and 90 after immunization with 40 μg, 10 μg, or 2.5 μg of H2O2-WNV-KUNV vaccine formulated with 0.1% alum in BALB/c mice. Data are pooled from 2 independent experiments. (B) WNV E-protein-specific ELISA comparing H2O2-WNV-KUNV vaccination in BALB/c and C57BL/6 mice immunized with 10 μg on days 0, 14, 28, 42, 60, and 90. On day 28, half of the mice in each group were boosted with the H2O2-WNV-KUNV vaccine (n = 20 BALB/c mice and 20 C57BL/6 mice). (C) Ninety days after vaccination (with or without boosting), the BALB/c and C57BL/6 mouse groups described in panel B were challenged with 106 PFU of WNV-NY via an i.c. route and monitored for survival. In addition, naïve BALB/c or C57BL/6 mice were challenged i.c. as controls.
Fig 3
Fig 3
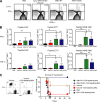
CD8+ T cell response in H2O2-WNV-KUNV-vaccinated C57BL/6 mice. (A) Flow cytometry contour plots showing IFN-γ+ CD8+ T cells after restimulation of cells with the E771 Kb-restricted peptide. From left to right are examples from PBS-treated, H2O2-WNV-KUNV-vaccinated, WNV-NY-infected, and WNV-KUNV-infected mice at day 8. (B) Summary of intracellular TNF-α and IFN-γ intracellular staining to identify WNV-specific CD8+ T cells following vaccination with 40 μg of H2O2-WNV-KUNV vaccine adjuvanted with 5 μg of MPL or infection with WNV-NY or WNV-KUNV. Eight days after vaccination or infection, splenocytes were harvested and stimulated with WNV-peptides E347, E771, and NS4B in the presence of brefeldin A for 6 h (n = 10 mice in each group in two independent experiments). (C) C57BL/6 mice were infected or vaccinated as described for panel B, and on days 28 and 32 postvaccination or postinfection, the mice received either 40 μg of anti-CD8β or an isotype control MAb. (Left) Flow cytometry contour plots show the efficiency of the depletion of CD8+ T cells; (right) on day 32, all mice were challenged with 106 PFU of WNV-NY via the i.c. route and monitored for survival (n = 15 mice in each group from two independent experiment). Asterisks indicate comparisons that are statistically significantly different (**, P < 0.01; *, P < 0.05).
Fig 4
Fig 4
CD8+ T cell response in HHDII mice after vaccination with H2O2-WNV-KUNV. (A) Eight days following immunization with 40 μg of H2O2-WNV-KUNV vaccine adjuvanted with 5 μg of MPL or infection with 104 PFU of WNV-KUNV, splenocytes were stained with an SVG9-specific MHC class I tetramer (n = 9 per group from three independent experiments). (Left) Percentage of tetramer-positive CD8+ T cells; (middle) number of tetramer-positive CD8+ T cells; (right) representative examples of SVG9 tetramer staining of lymphocytes from H2O2-WNV-KUNV-vaccinated or WNV-KUNV-infected HHDII mice. Some background staining (0.18 to 0.2%) of the SVG9 tetramer was observed in cells of the CD8-negative gate from PBS-treated, vaccinated, or WNV-infected mice. This level corresponded to that (0.21%) seen in the CD8+ T cell gate from PBS-treated animals. (B) The tetramer-positive SVG9-specific CD8+ T cells from panel A were stained with antibodies against CD127, PD1, and CD62. The filled green histograms represent staining of naïve CD8+ T cells and are shown as a negative control. The relative geometric mean fluorescence intensity (GMFI) reflects data pooled from several independent experiments after normalization. (C) Summary of flow cytometry data showing TNF-α+ CD8+ T cells, IFN-γ+ CD8+ T cells, and IFN-γ+ TNF-α+ CD8+ T cells after restimulation of cells with the SVG9 peptide. Representative examples shown are from H2O2-WNV-KUNV-vaccinated or WNV-KUNV-infected mice at day 8. Far right panel, summary of intracellular TNF-α and IFN-γ intracellular staining to identify WNV-specific CD8+ T cells following vaccination with 40 μg of H2O2-WNV-KUNV vaccine adjuvanted with 5 μg of MPL or infection with WNV-KUNV. Eight days after infection or vaccination, splenocytes were harvested and stimulated with SVG9 in the presence of brefeldin A for 6 h (n = 10 mice for each group from two independent experiments). (D) Splenocytes from vaccinated H2O2-WNV-KUNV- or WNV-KUNV-infected HHDII mice were stimulated ex vivo with different doses of SVG9 peptide, and the production of IFN-γ and TNF-α was analyzed (n = 8 mice). Asterisks in this figure indicate comparisons that are statistically significantly different (***, P < 0.001; **, P < 0.01; *, P < 0.05).
Fig 5
Fig 5
Vaccination and challenge of aged mice. (A) Aged C57BL/6 mice (age, 18 months) were vaccinated with 10 μg of H2O2-WNV-KUNV vaccine adjuvanted with 0.1% alum (n = 15), vaccinated with 100 μ1 of WNV-Innovator (n = 15), or administered 0.1% alum alone (n = 15), and at 28 days after vaccination, the mice were boosted. All groups were phlebotomized on days 0, 14, 28, 42, 60, and 90 postvaccination, and the titer of serum IgG against WNV E protein was measured by ELISA. (B) On day 90 postimmunization, neutralization titers in serum from the mice described in panel A were measured. (C) Vaccinated mice were challenged i.c. with 104 PFU of WNV-NY on day 90 and monitored for survival. Asterisks indicate comparisons that are statistically significantly different (***, P < 0.001; **, P < 0.01).

Similar articles

Cited by

References

    1. Petersen LR, Carson PJ, Biggerstaff BJ, Custer B, Borchardt SM, Busch MP. 2012. Estimated cumulative incidence of West Nile virus infection in US adults, 1999-2010. Epidemiol. Infect., p 1–5 - PMC - PubMed
    1. Mostashari F, Bunning ML, Kitsutani PT, Singer DA, Nash D, Cooper MJ, Katz N, Liljebjelke KA, Biggerstaff BJ, Fine AD, Layton MC, Mullin SM, Johnson AJ, Martin DA, Hayes EB, Campbell GL. 2001. Epidemic West Nile encephalitis, New York, 1999: results of a household-based seroepidemiological survey. Lancet 358:261–264 - PubMed
    1. Asnis DS, Conetta R, Teixeira AA, Waldman G, Sampson BA. 2000. The West Nile virus outbreak of 1999 in New York: the Flushing Hospital experience. Clin. Infect. Dis. 30:413–418 - PubMed
    1. Hubalek Z, Halouzka J. 1999. West Nile fever—a reemerging mosquito-borne viral disease in Europe. Emerg. Infect. Dis. 5:643–650 - PMC - PubMed
    1. Murray K, Baraniuk S, Resnick M, Arafat R, Kilborn C, Cain K, Shallenberger R, York TL, Martinez D, Hellums JS, Hellums D, Malkoff M, Elgawley N, McNeely W, Khuwaja SA, Tesh RB. 2006. Risk factors for encephalitis and death from West Nile virus infection. Epidemiol. Infect. 134:1325–1332 - PMC - PubMed

Publication types

MeSH terms