

A chromatin link to caste identity in the carpenter ant Camponotus floridanus
- PMID: 23212948
- PMCID: PMC3589537
- DOI: 10.1101/gr.148361.112
A chromatin link to caste identity in the carpenter ant Camponotus floridanus
Abstract
In many ant species, sibling larvae follow alternative ontogenetic trajectories that generate striking variation in morphology and behavior among adults. These organism-level outcomes are often determined by environmental rather than genetic factors. Therefore, epigenetic mechanisms may mediate the expression of adult polyphenisms. We produced the first genome-wide maps of chromatin structure in a eusocial insect and found that gene-proximal changes in histone modifications, notably H3K27 acetylation, discriminate two female worker and male castes in Camponotus floridanus ants and partially explain differential gene expression between castes. Genes showing coordinated changes in H3K27ac and RNA implicate muscle development, neuronal regulation, and sensory responses in modulating caste identity. Binding sites of the acetyltransferase CBP harbor the greatest caste variation in H3K27ac, are enriched with motifs for conserved transcription factors, and show evolutionary expansion near developmental and neuronal genes. These results suggest that environmental effects on caste identity may be mediated by differential recruitment of CBP to chromatin. We propose that epigenetic mechanisms that modify chromatin structure may help orchestrate the generation and maintenance of polyphenic caste morphology and social behavior in ants.
Figures
 ,…,
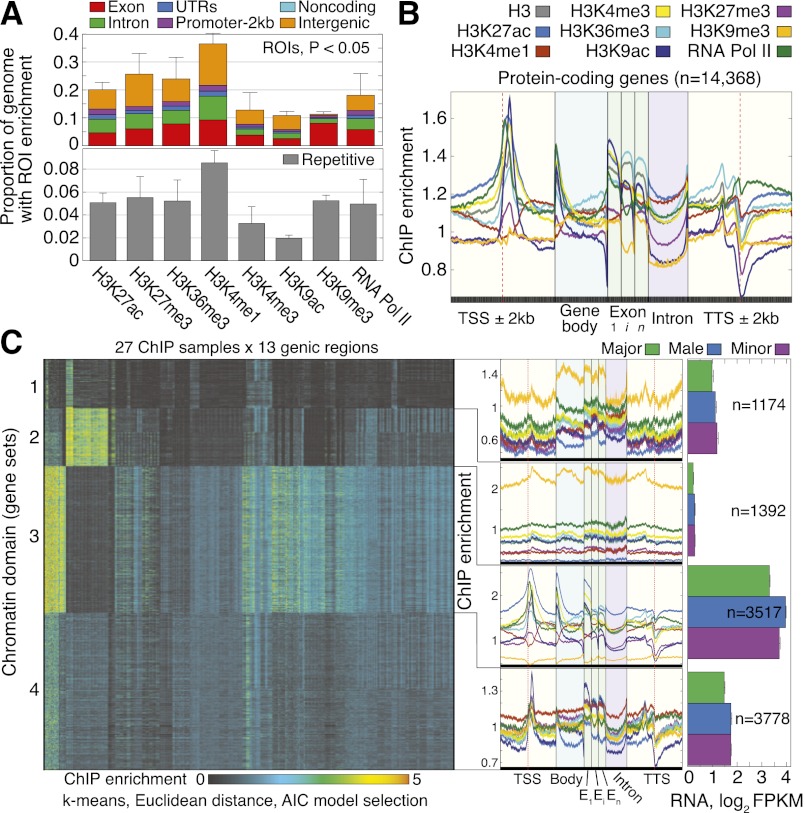
,…,  for ChIP samples p, averaged over castes and all protein-coding genes that contain significant PTM prevalence (14,368 genes). Error bars denote SE over genes. (TSS) Transcription start site; (Exon) first (1), internal (i), and last (n) exons; (TTS) transcription termination site; (kb) kilobase. (C) Visualization of the 351-dimensional ChIP-seq data set summarized for 9861 protein-coding genes, grouped by k-means clustering into k = 4 significant clusters (chromatin domains) using AIC model selection and a Euclidean distance measure. Columns were grouped by hierarchical clustering with a Euclidean distance measure. (Middle) ChIP enrichment profiles averaged over gene loci from each chromatin domain. On right, average expression levels for genes in each chromatin domain, separated by caste. Error bars denote SE over genes. (FPKM) Fragments per kilobase per million (mapped) reads (proxy for mRNA expression level).
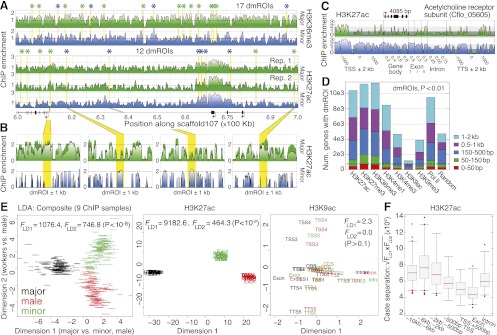
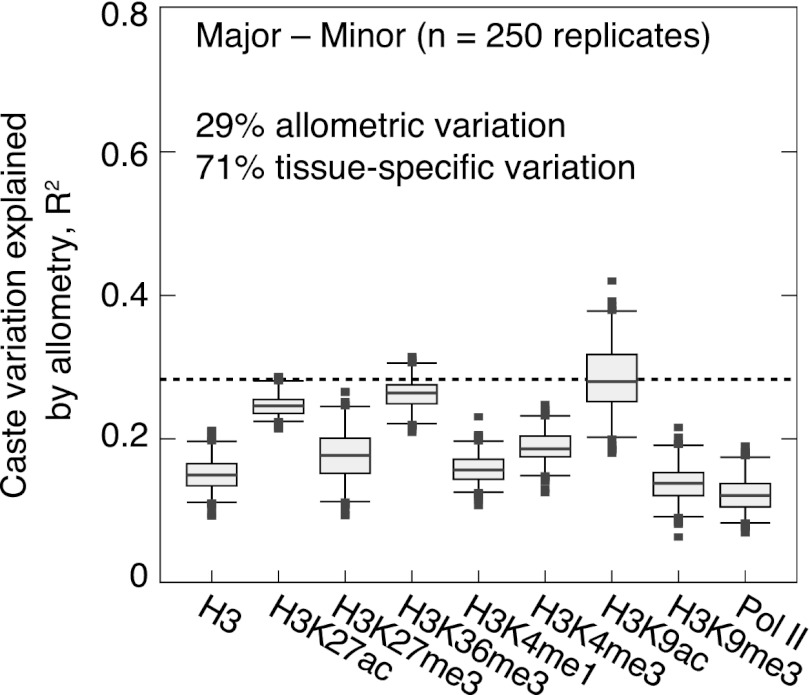
 was assessed near genes as shown by randomly sampling 10,000 loci and performing LD analysis, as done in E. Each distribution shows n > 30 replicates. (Boxes) 25th–75th percentiles; (whiskers) 5th–95th percentiles; (points) outliers. (bp) Base pairs.
Similar articles
-
Epigenetic (re)programming of caste-specific behavior in the ant Camponotus floridanus.Science. 2016 Jan 1;351(6268):aac6633. doi: 10.1126/science.aac6633. Science. 2016. PMID: 26722000 Free PMC article.
-
Genome-wide and caste-specific DNA methylomes of the ants Camponotus floridanus and Harpegnathos saltator.Curr Biol. 2012 Oct 9;22(19):1755-64. doi: 10.1016/j.cub.2012.07.042. Epub 2012 Aug 9. Curr Biol. 2012. PMID: 22885060 Free PMC article.
-
Phenotypically distinct female castes in honey bees are defined by alternative chromatin states during larval development.Genome Res. 2018 Oct;28(10):1532-1542. doi: 10.1101/gr.236497.118. Epub 2018 Aug 22. Genome Res. 2018. PMID: 30135090 Free PMC article.
-
The role of chromatin and epigenetics in the polyphenisms of ant castes.Brief Funct Genomics. 2014 May;13(3):235-45. doi: 10.1093/bfgp/elt056. Epub 2014 Jan 24. Brief Funct Genomics. 2014. PMID: 24462993 Review.
-
Caste development and evolution in ants: it's all about size.J Exp Biol. 2017 Jan 1;220(Pt 1):53-62. doi: 10.1242/jeb.145292. J Exp Biol. 2017. PMID: 28057828 Review.
Cited by
-
DNA methylation and chromatin organization in insects: insights from the Ant Camponotus floridanus.Genome Biol Evol. 2015 Feb 26;7(4):931-42. doi: 10.1093/gbe/evv039. Genome Biol Evol. 2015. PMID: 25724207 Free PMC article.
-
Ant genomics sheds light on the molecular regulation of social organization.Genome Biol. 2013 Jul 29;14(7):212. doi: 10.1186/gb-2013-14-7-212. Genome Biol. 2013. PMID: 23895728 Free PMC article. Review.
-
Eusocial insects as emerging models for behavioural epigenetics.Nat Rev Genet. 2014 Oct;15(10):677-88. doi: 10.1038/nrg3787. Epub 2014 Sep 9. Nat Rev Genet. 2014. PMID: 25200663 Review.
-
The genomewide transcriptional response underlying the pea aphid wing polyphenism.Mol Ecol. 2016 Sep;25(17):4146-60. doi: 10.1111/mec.13749. Epub 2016 Aug 8. Mol Ecol. 2016. PMID: 27393739 Free PMC article.
-
ChIP-seq profiling of H3K4me3 and H3K27me3 in an invasive insect, Bactrocera dorsalis.Front Genet. 2023 Feb 23;14:1108104. doi: 10.3389/fgene.2023.1108104. eCollection 2023. Front Genet. 2023. PMID: 36911387 Free PMC article.
References
-
- Alarcón JM, Malleret G, Touzani K, Vronskaya S, Ishii S, Kandel ER, Barco A 2004. Chromatin acetylation, memory, and LTP are impaired in CBP+/− mice: A model for the cognitive deficit in Rubinstein-Taybi syndrome and its amelioration. Neuron 42: 947–959 - PubMed
-
- Amberg DC, Burke DJ, Strathern JN 2000. Methods in yeast genetics: A Cold Spring Harbor laboratory course manual, pp. 149–154. Cold Spring Harbor Laboratory Press, Cold Spring Harbor, NY
-
- Bejarano F, Busturia A 2004. Function of the trithorax-like gene during Drosophila development. Dev Biol 268: 327–341 - PubMed
Publication types
MeSH terms
Substances
Grants and funding
LinkOut - more resources
Full Text Sources
Molecular Biology Databases