Accurate prediction of the dynamical changes within the second PDZ domain of PTP1e
- PMID: 23209399
- PMCID: PMC3510070
- DOI: 10.1371/journal.pcbi.1002794
Accurate prediction of the dynamical changes within the second PDZ domain of PTP1e
Abstract
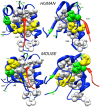
Experimental NMR relaxation studies have shown that peptide binding induces dynamical changes at the side-chain level throughout the second PDZ domain of PTP1e, identifying as such the collection of residues involved in long-range communication. Even though different computational approaches have identified subsets of residues that were qualitatively comparable, no quantitative analysis of the accuracy of these predictions was thus far determined. Here, we show that our information theoretical method produces quantitatively better results with respect to the experimental data than some of these earlier methods. Moreover, it provides a global network perspective on the effect experienced by the different residues involved in the process. We also show that these predictions are consistent within both the human and mouse variants of this domain. Together, these results improve the understanding of intra-protein communication and allostery in PDZ domains, underlining at the same time the necessity of producing similar data sets for further validation of thses kinds of methods.
Conflict of interest statement
The authors have declared that no competing interests exist.
Figures


Similar articles
-
Crystallographic and nuclear magnetic resonance evaluation of the impact of peptide binding to the second PDZ domain of protein tyrosine phosphatase 1E.Biochemistry. 2010 Nov 2;49(43):9280-91. doi: 10.1021/bi101131f. Biochemistry. 2010. PMID: 20839809 Free PMC article.
-
Mapping of two networks of residues that exhibit structural and dynamical changes upon binding in a PDZ domain protein.J Am Chem Soc. 2008 Jul 16;130(28):8931-9. doi: 10.1021/ja0752080. Epub 2008 Jun 18. J Am Chem Soc. 2008. PMID: 18558679
-
Rigid Residue Scan Simulations Systematically Reveal Residue Entropic Roles in Protein Allostery.PLoS Comput Biol. 2016 Apr 26;12(4):e1004893. doi: 10.1371/journal.pcbi.1004893. eCollection 2016 Apr. PLoS Comput Biol. 2016. PMID: 27115535 Free PMC article.
-
Change in allosteric network affects binding affinities of PDZ domains: analysis through perturbation response scanning.PLoS Comput Biol. 2011 Oct;7(10):e1002154. doi: 10.1371/journal.pcbi.1002154. Epub 2011 Oct 6. PLoS Comput Biol. 2011. PMID: 21998559 Free PMC article. Review.
-
Seeking allosteric networks in PDZ domains.Protein Eng Des Sel. 2018 Oct 1;31(10):367-373. doi: 10.1093/protein/gzy033. Protein Eng Des Sel. 2018. PMID: 30690500 Free PMC article. Review.
Cited by
-
Kinetic response of a photoperturbed allosteric protein.Proc Natl Acad Sci U S A. 2013 Jul 16;110(29):11725-30. doi: 10.1073/pnas.1306323110. Epub 2013 Jul 1. Proc Natl Acad Sci U S A. 2013. PMID: 23818626 Free PMC article.
-
ASD v2.0: updated content and novel features focusing on allosteric regulation.Nucleic Acids Res. 2014 Jan;42(Database issue):D510-6. doi: 10.1093/nar/gkt1247. Epub 2013 Nov 28. Nucleic Acids Res. 2014. PMID: 24293647 Free PMC article.
-
Dynamically Coupled Residues within the SH2 Domain of FYN Are Key to Unlocking Its Activity.Structure. 2016 Nov 1;24(11):1947-1959. doi: 10.1016/j.str.2016.08.016. Epub 2016 Sep 29. Structure. 2016. PMID: 27692963 Free PMC article.
-
Allosteric activation of Bordetella pertussis adenylyl cyclase by calmodulin: molecular dynamics and mutagenesis studies.J Biol Chem. 2014 Jul 25;289(30):21131-41. doi: 10.1074/jbc.M113.530410. J Biol Chem. 2014. PMID: 24907274 Free PMC article.
-
SenseNet, a tool for analysis of protein structure networks obtained from molecular dynamics simulations.PLoS One. 2022 Mar 17;17(3):e0265194. doi: 10.1371/journal.pone.0265194. eCollection 2022. PLoS One. 2022. PMID: 35298511 Free PMC article.
References
-
- Ponting CP, Phillips C, Davies KE, Blake DJ (1997) PDZ domains: targeting signalling molecules to sub-membranous sites. BioEssays 19: 469–479. - PubMed
-
- Fuentes EJ, Der CJ, Lee AL (2004) Ligand-dependent dynamics and intramolecular signaling in a PDZ domain. Journal of molecular biology 335: 1105–1115. - PubMed
-
- Gianni S, Walma T, Arcovito A, Calosci N, Bellelli A, et al. (2006) Demonstration of long-range interactions in a PDZ domain by NMR, kinetics, and protein engineering. Structure 14: 1801–1809. - PubMed
Publication types
MeSH terms
Substances
Grants and funding
LinkOut - more resources
Full Text Sources

