. 2012 Dec 17;209(13):2339-50.
doi: 10.1084/jem.20120873. Epub 2012 Dec 3.

Lysophosphatidic acid targets vascular and oncogenic pathways via RAGE signaling

Affiliations

Lysophosphatidic acid targets vascular and oncogenic pathways via RAGE signaling

Vivek Rai et al. J Exp Med. .

Abstract

The endogenous phospholipid lysophosphatidic acid (LPA) regulates fundamental cellular processes such as proliferation, survival, motility, and invasion implicated in homeostatic and pathological conditions. Hence, delineation of the full range of molecular mechanisms by which LPA exerts its broad effects is essential. We report avid binding of LPA to the receptor for advanced glycation end products (RAGE), a member of the immunoglobulin superfamily, and mapping of the LPA binding site on this receptor. In vitro, RAGE was required for LPA-mediated signal transduction in vascular smooth muscle cells and C6 glioma cells, as well as proliferation and migration. In vivo, the administration of soluble RAGE or genetic deletion of RAGE mitigated LPA-stimulated vascular Akt signaling, autotaxin/LPA-driven phosphorylation of Akt and cyclin D1 in the mammary tissue of transgenic mice vulnerable to carcinogenesis, and ovarian tumor implantation and development. These findings identify novel roles for RAGE as a conduit for LPA signaling and suggest targeting LPA-RAGE interaction as a therapeutic strategy to modify the pathological actions of LPA.


Figures
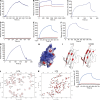
Figure 1.
Figure 1.
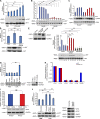
Direct binding of LPA to RAGE: SPR and NMR. (A) Binding of 218 nM LPA to the immobilized sRAGE surface on CM5 sensor chip and SPR sensorgrams. (B) A monolayer of POPC liposomes was formed on the flow cell 1 (dark blue), and a monolayer of LPA-POPC liposomes was formed on the flow cell 2 (dark red). (C) Binding of 4 nM sRAGE to the immobilized LPA surface on HPA sensor chip. (D) sRAGE does not bind to POPC liposomes immobilized on flow cell 1 HPA sensor chip in sRAGE-LPA binding experiment (red curve). (E) SPR sensorgrams indicating that 1 µM sRAGE does not interact with immobilized S1P-POPC surface on flow cell 2 of the HPA sensor chip (dark red) and that sRAGE binds to LPA on flow cell 1 immobilized with LPA-POPC as the positive control for binding interaction (blue curve). (F) Binding of 9 nM RAGE V domain to the immobilized LPA surface. (G) Binding of 1 µM RAGE C2 domain to the immobilized LPA surface on HPA sensor chip. (H) Surface representation of the V domain (PDB 3CJJ) colored by electrostatic field, showing the highly basic (blue) character of the LPA binding surface. (I) NMR chemical shift perturbations mapped on the structure of the V domain (PDB 3CJJ) for LPA and Ca2+-loaded S100B. The significantly perturbed residues are highlighted in red. (J) 15N-1H HSQC NMR spectrum of 15N-enriched C2 domain in the absence (black) and presence (red) of LPA. (K) Complete 15N-1H HSQC NMR spectrum of 15N-enriched C2 domain in the absence (black) and presence (red) of LPA. (L) Binding of 1 µM sRAGE with 1 µM BSA or 1 µM S100B to the immobilized LPA liposomes on HPA sensor chip (blue and red, respectively). SPR assays results shown are representative of three independent experiments.
Figure 2.
Figure 2.
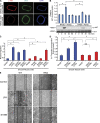
RAGE is a functional LPA receptor in vascular SMCs. (A) Quantified levels of phosphorylated/total AKT are shown in wild-type and RAGE-null SMCs, upon 0 to 0.01–20 µM LPA stimulation. (B and C) Quantified levels of phosphorylated/total AKT (B) and ERK (C) are shown in wild-type and RAGE-null SMCs, upon 10 µM LPA stimulation at the indicated times. (D–G) Quantified levels of phosphorylated/total AKT induced by LPA were tested in the presence of sRAGE (D), in the presence of SMCs transfected with control vector, full-length RAGE or DN RAGE (E and F), or in RAGE-null SMCs transfected with vector, or full-length RAGE (G). In E, RAGE levels are shown by Western blotting in transfected SMCs and, after probing with the primary anti-RAGE antibody, blots were stripped and reprobed with antibody to GAPDH. (H) Real time PCR for LPA receptors 1–5 and RAGE gene products was performed, normalized to 18s transcript levels, and expressed as fold change comparing wild-type versus RAGE-null SMCs. (I) LPA1 receptor levels as shown by Western blotting in wild-type and RAGE-null SMCs. After probing with the primary anti-LPA1 antibody, blots were stripped and reprobed with antibody to GAPDH. NS, not significant. (J) Transiently transfected scramble control (PBS) or scramble, LPA1 + LPA2 siRNAs, or RAGE siRNA–transfected primary murine aortic SMCs were stimulated with 10 µM LPA. Total lysates were subjected to Western blotting with antibodies against total AKT or p-AKT. Quantified levels of phosphorylated/total Akt in the wild-type–transfected SMCs are shown (fold changes are relative to control). **, P < 0.05. Assays results shown are representative of three independent experiments. Error bars represent SD.
Figure 3.
Figure 3.
RAGE activates ERK in RH-7777 in rat hepatoma cells. (A) Real-time PCR for LPA receptors 1–5 and RAGE mRNA transcripts was performed in RH-7777 cells and normalized to 18s transcript levels. The graphs show relative fold of LPA receptor transcripts in RH-7777 cells. Assays were performed in triplicate and results shown are representative of two independent experiments. (B) Quantified levels of phosphorylated/total ERK are shown in RH-7777 rat hepatoma cells transfected with control vector, full-length RAGE, and upon 10 µM LPA stimulation at the indicated times. Representative results from triplicate experiments and at least two independent experiments are shown. *, P < 0.05. Error bars represent SD.
Figure 4.
Figure 4.
LPA infusion into mouse hearts activates Akt signal transduction via RAGE. (A) LPA (200 µl of a 100 µM solution) was infused directly into wild-type and RAGE-null mice left ventricles. Aortas were retrieved and confocal microscopy was performed on aortic tissue and subjected to immunostaining for detection for p-Akt (15 min). The left column reveals staining with a p-Akt-specific antibody; the middle column reveals staining with monoclonal mouse smooth muscle actin antibody specific to SMC-actin; and the right column reveals the DAPI staining for nuclei. Bar, 100 µm. (B) Mice aortas were retrieved at the indicated times, lysed, and LPA-induced Akt phosphorylation was determined by Western blotting. (C and D) Wild-type and RAGE-null SMCs were treated with 10 µM LPA, 10 µg/ml S100B, or 10 ng/ml platelet-derived growth factor (PDGF) for 5 or 48 h, and migration (C) and proliferation (D), respectively, were assessed. Error bars represent SD. Assays were performed in triplicate and results are representative of three independent experiments. (E) Serum-starved RAGE-expressing SMCs and RAGE-null SMCs were scratched and treated with 10 µM LPA or 10 µg/ml S100B for 18-h LPA-stimulated wound healing in RAGE-expressing SMCs but not in RAGE-null SMCs. RAGE ligand S100B was used as reference. Bar, 100 µm. Assays were performed in triplicate and results are representative of three independent experiments. *, P < 0.005.
Figure 5.
Figure 5.
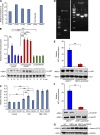
RAGE is a functional LPA receptor on C6 glioma tumor cells and is required for atx/LPA-mediated signaling in vivo. (A) Relative expression of transcripts of LPA receptors. Real-time PCR for LPA receptors 1–5 and RAGE gene products was performed, normalized to 18s transcript levels, and expressed as fold change in C6 glioma cells. The graphs show relative fold of LPA receptor transcripts. Assays were performed in triplicate and results are representative of two independent experiments. Error bars represent SD. (B) Quantified levels of phosphorylated/total ERK in the C6, C6 full-length RAGE, and C6 DN-RAGE cells upon LPA stimulation (10 µM) at different times, determined by Western blotting are shown. Fold changes are relative to control. (C) Colony-forming unit assays were performed in C6 glioma cells in the presence of control vector, full-length RAGE, or DN RAGE in the presence of 10 µM LPA or fetal bovine serum (10%). In B and C, ** indicates P < 0.05. Assays were performed and results are representative of three (B) and two (C) independent experiments. Error bars represent SD. (D–G) MMTV-atx mice were bred into the RAGE-null background and these mice and littermate RAGE-expressing MMTV-atx mice were studied. (D) Genotyping of MMTV-atx and RAGE mice. Left panel shows the genotyping of MMTV-atx mice; PCR was performed according to established protocols. Right panel shows the genotyping of RAGE-expressing (+/+), heterozygous (+/−), and null (−/−) mice using protocols established in our laboratory. Note that Mouse #2 for example is an MMTV-atx+ (hemizygous)/RAGE-null mouse used in the studies. (E and F) At 6 wk of age, mammary tissue was retrieved and subjected to Western blotting for detection of phosphorylated/total Akt and phosphorylated/total cyclin D1. n = at least 3 replicates per group; **, P < 0.005. Error bars represent SD. (G) Mammary tissue from wild-type, MMTV-atx/RAGE–expressing mice, and MMTV-atx/RAGE-null mice was retrieved at age 6 wk and subjected to Western blotting for detection of atx. n = 3 mice per group.
Figure 6.
Figure 6.
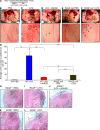
RAGE is a functional LPA receptor: RAGE deletion and sRAGE block LPA-induced growth of implanted ID8 tumor cells. (A) RAGE expression is shown by Western blotting in ID8 ovarian cancer cells probing with the primary anti-RAGE antibody in murine SMC lysates (lanes 1 and 2) and murine ID8 cells (lanes 3 and 4). Assays were performed in triplicate and results are representative of two independent experiments. (B–L) ID8 ovarian cancer cells were implanted into immunocompetent wild-type mice receiving PBS (B), wild-type mice receiving LPA (C), wild-type mice receiving LPA and sRAGE (D), RAGE-null mice receiving PBS (E), and RAGE-null mice receiving LPA (F), and tumor numbers/cm2 on day 28 are shown, n = 5 per group (G). The dose of LPA was 200 µl of a 100 µM solution given per day. sRAGE (200 µl of a 50 µM solution/day for 28 d) was administered to mice in F. Bar, 3 mm. (H–L) Representative H&E stained images of tumors retrieved from the peritoneal cavity on day 28 of mice bearing ID8 cells tumors after the indicated treatments are shown. Bar, 100 µm. Error bars represent SD. **, P < 0.05.

Similar articles

Cited by

References

    1. Bu D.X., Rai V., Shen X., Rosario R., Lu Y., D’Agati V., Yan S.F., Friedman R.A., Nuglozeh E., Schmidt A.M. 2010. Activation of the ROCK1 branch of the transforming growth factor-beta pathway contributes to RAGE-dependent acceleration of atherosclerosis in diabetic ApoE-null mice. Circ. Res. 106:1040–1051 10.1161/CIRCRESAHA.109.201103 - DOI - PMC - PubMed
    1. Cechin S.R., Dunkley P.R., Rodnight R. 2005. Signal transduction mechanisms involved in the proliferation of C6 glioma cells induced by lysophosphatidic acid. Neurochem. Res. 30:603–611 10.1007/s11064-005-2747-4 - DOI - PubMed
    1. Chen Y., Yan S.S., Colgan J., Zhang H.P., Luban J., Schmidt A.M., Stern D., Herold K.C. 2004. Blockade of late stages of autoimmune diabetes by inhibition of the receptor for advanced glycation end products. J. Immunol. 173:1399–1405 - PubMed
    1. Choi J.W., Herr D.R., Noguchi K., Yung Y.C., Lee C.W., Mutoh T., Lin M.E., Teo S.T., Park K.E., Mosley A.N., Chun J. 2010. LPA receptors: subtypes and biological actions. Annu. Rev. Pharmacol. Toxicol. 50:157–186 10.1146/annurev.pharmtox.010909.105753 - DOI - PubMed
    1. Chun J., Hla T., Lynch K.R., Spiegel S., Moolenaar W.H. 2010. International Union of Basic and Clinical Pharmacology. LXXVIII. Lysophospholipid receptor nomenclature. Pharmacol. Rev. 62:579–587 10.1124/pr.110.003111 - DOI - PMC - PubMed

Publication types

MeSH terms