

Spatio-temporal dynamics of viruses are differentially affected by parasitoids depending on the mode of transmission
- PMID: 23202516
- PMCID: PMC3509684
- DOI: 10.3390/v4113069
Spatio-temporal dynamics of viruses are differentially affected by parasitoids depending on the mode of transmission
Abstract
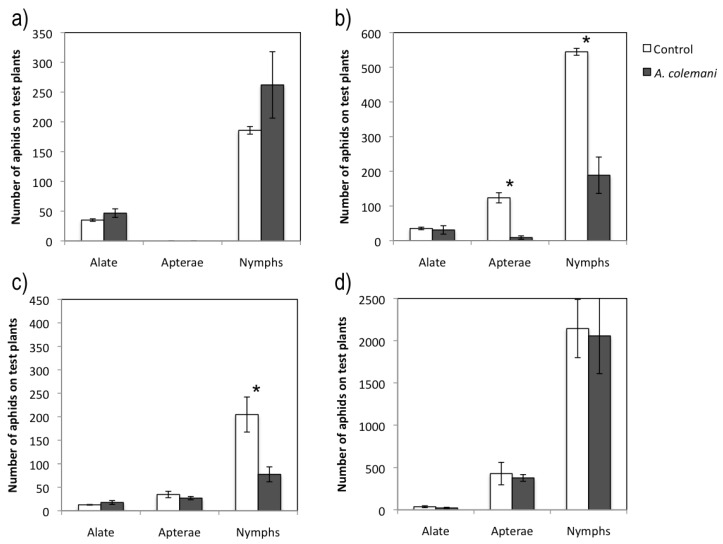
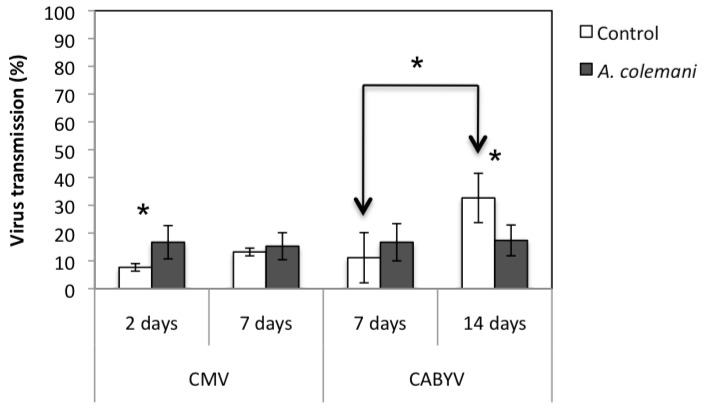
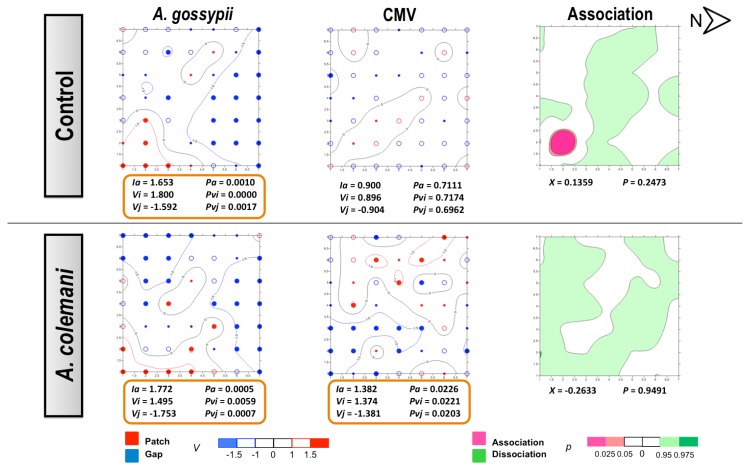
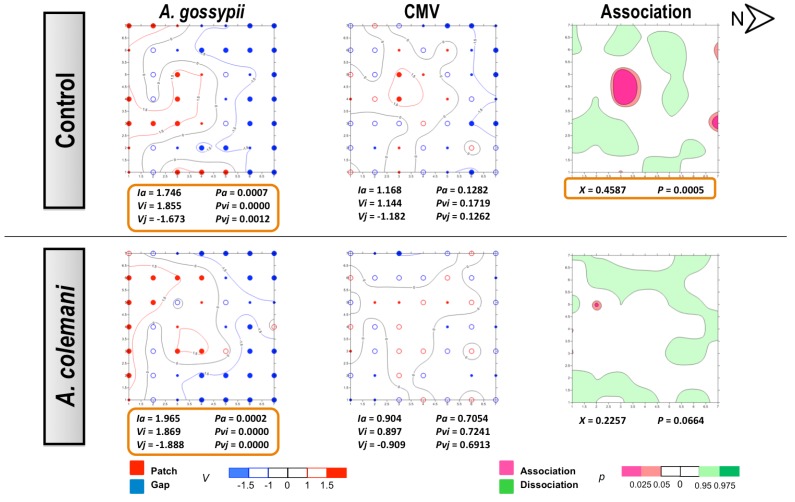
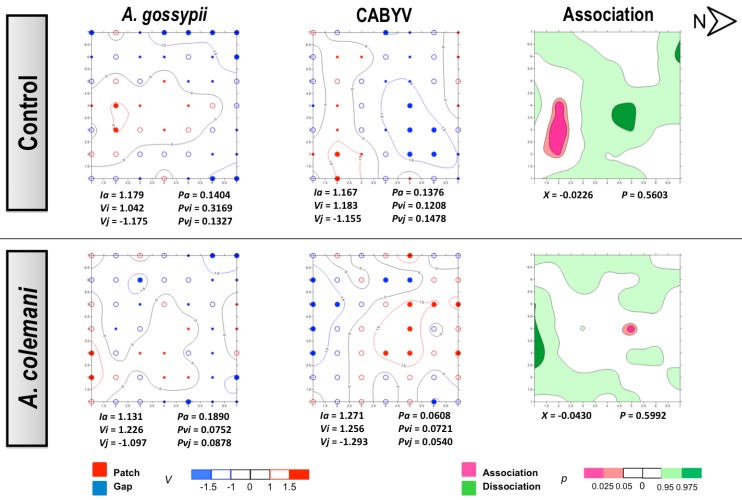
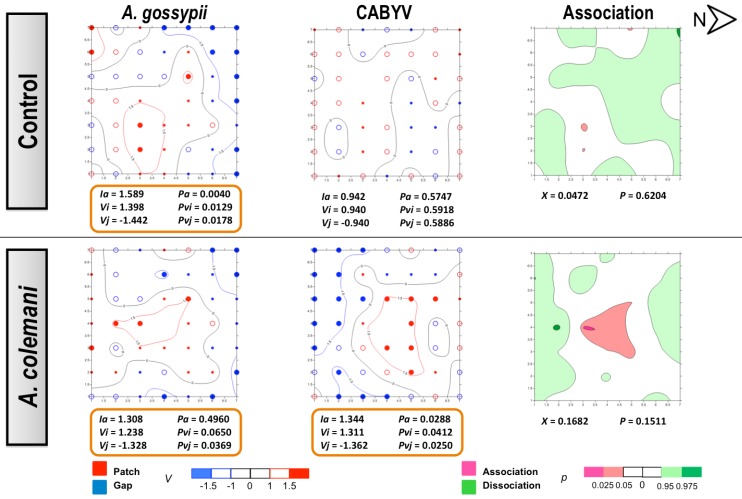
Relationships between agents in multitrophic systems are complex and very specific. Insect-transmitted plant viruses are completely dependent on the behaviour and distribution patterns of their vectors. The presence of natural enemies may directly affect aphid behaviour and spread of plant viruses, as the escape response of aphids might cause a potential risk for virus dispersal. The spatio-temporal dynamics of Cucumber mosaic virus (CMV) and Cucurbit aphid-borne yellows virus (CABYV), transmitted by Aphis gossypii in a non-persistent and persistent manner, respectively, were evaluated at short and long term in the presence and absence of the aphid parasitoid, Aphidius colemani. SADIE methodology was used to study the distribution patterns of both the virus and its vector, and their degree of association. Results suggested that parasitoids promoted aphid dispersion at short term, which enhanced CMV spread, though consequences of parasitism suggest potential benefits for disease control at long term. Furthermore, A. colemani significantly limited the spread and incidence of the persistent virus CABYV at long term. The impact of aphid parasitoids on the dispersal of plant viruses with different transmission modes is discussed.
Figures
Similar articles
-
A non-persistently transmitted-virus induces a pull-push strategy in its aphid vector to optimize transmission and spread.Virus Res. 2014 Jun 24;186:38-46. doi: 10.1016/j.virusres.2013.12.012. Epub 2013 Dec 26. Virus Res. 2014. PMID: 24373951
-
The effect of Chrysoperla carnea (Neuroptera: Chrysopidae) and Adalia bipunctata (Coleoptera: Coccinellidae) on the spread of cucumber mosaic virus (CMV) by Aphis gossypii (Hemiptera: Aphididae).Bull Entomol Res. 2015 Feb;105(1):13-22. doi: 10.1017/S0007485314000534. Epub 2014 Sep 11. Bull Entomol Res. 2015. PMID: 25208589
-
Plant viruses induce plant volatiles that are detected by aphid parasitoids.Sci Rep. 2023 May 30;13(1):8721. doi: 10.1038/s41598-023-35946-3. Sci Rep. 2023. PMID: 37253808 Free PMC article.
-
Modelling and manipulation of aphid-mediated spread of non-persistently transmitted viruses.Virus Res. 2020 Feb;277:197845. doi: 10.1016/j.virusres.2019.197845. Epub 2019 Dec 23. Virus Res. 2020. PMID: 31874210 Free PMC article. Review.
-
Effect of aphid biology and morphology on plant virus transmission.Pest Manag Sci. 2022 Feb;78(2):416-427. doi: 10.1002/ps.6629. Epub 2021 Sep 21. Pest Manag Sci. 2022. PMID: 34478603 Review.
Cited by
-
The Epidemiology of Plant Virus Disease: Towards a New Synthesis.Plants (Basel). 2020 Dec 14;9(12):1768. doi: 10.3390/plants9121768. Plants (Basel). 2020. PMID: 33327457 Free PMC article. Review.
-
Bugs scaring bugs: enemy-risk effects in biological control systems.Ecol Lett. 2020 Nov;23(11):1693-1714. doi: 10.1111/ele.13601. Epub 2020 Sep 9. Ecol Lett. 2020. PMID: 32902103 Free PMC article. Review.
-
Infection of host plants by Cucumber mosaic virus increases the susceptibility of Myzus persicae aphids to the parasitoid Aphidius colemani.Sci Rep. 2015 Jun 4;5:10963. doi: 10.1038/srep10963. Sci Rep. 2015. PMID: 26043237 Free PMC article.
-
Does the Infectious Status of Aphids Influence Their Preference Towards Healthy, Virus-Infected and Endophytically Colonized Plants?Insects. 2020 Jul 11;11(7):435. doi: 10.3390/insects11070435. Insects. 2020. PMID: 32664588 Free PMC article.
-
Aphidius colemani Behavior Changes Depending on Volatile Organic Compounds Emitted by Plants Infected with Viruses with Different Modes of Transmission.Insects. 2024 Jan 29;15(2):92. doi: 10.3390/insects15020092. Insects. 2024. PMID: 38392512 Free PMC article.
References
-
- Nault L.R. Arthropod transmission of plant viruses: A new synthesis. Ann. Entomol. Soc. Am. 1997;90:521–541.
-
- Hull R. Matthews’ Plant Virology. 4th. Academic Press; New York, USA: 2002.
-
- Döring T.F., Chittka L. Visual ecology of aphids: A critical review on the role of colours in host finding. Arthropod.-Plant Interact. 2007;1:3–16. doi: 10.1007/s11829-006-9000-1. - DOI
Publication types
MeSH terms
LinkOut - more resources
Full Text Sources
