. 2012 Nov 28;9(1):49.
doi: 10.1186/1476-9255-9-49.

Expression analysis of inflammasomes in experimental models of inflammatory and fibrotic liver disease

Affiliations

Expression analysis of inflammasomes in experimental models of inflammatory and fibrotic liver disease

Sorina Georgiana Boaru et al. J Inflamm (Lond). .

Abstract

During inflammation, the inflammasomes representing a group of multi-protein complexes trigger the biological maturation of pro-inflammatory cytokines such as interleukin-1β and interleukin-18 by proteolytic activation of caspase-1 from its inactive proforms. The individual genes encoding components of the inflammasome machinery are regulated at transcriptional and post-transcriptional levels. Once activated, they drive a wide variety of cellular responses that are necessary to mediate host defense against microbial pathogens and to guarantee tissue homeostasis. In the present work, we have studied the expression of the different inflammasomes in various primary hepatic cell subpopulations, in models of acute inflammation and during experimental liver fibrogenesis. We demonstrate that NLRP-1, NLRP-3 and AIM2 are prominently expressed in Kupffer cells and liver sinusoidal endothelial cells, moderately expressed in periportal myofibroblasts and hepatic stellate cells, and virtually absent in primary cultured hepatocytes. We found that the challenge with the lipopolysaccharides results in a time- and concentration-dependent expression of the NOD-like receptor family members NLRP-1, NLRP-3 and NLRC4/NALP4 in cultured hepatic stellate cells and a strong transcriptional activation of NLRP-3 in hepatocytes. Moreover, we detect a diverse regulatory network of the different inflammasomes in the chosen experimental models of acute and chronic liver insult suggesting that the various inflammasomes might contribute simultaneously to the outcome of inflammatory and fibrotic liver insult, irrespectively of the underlying inflammatory stimulus.


Figures

Figure 1
Figure 1
Expression of NLRP-1, NLRP-3 and AIM2 in primary hepatic cells. Total RNA from Kupffer cells (KC) cultured for 2 days, freshly isolated sinusoidal endothelial cells (LSEC), portal fibroblasts (pF) in primary culture, hepatic stellate cells (HSC/MFB) cultured for 4 days and hepatocytes (PC) cultured for 2 days were isolated and subjected to quantitative real time PCR for NLRP-1, NLRP-3, and AIM2. In this analysis, the expression of the different genes was set to 100% in KC. The individual primers used for quantitative analysis are depicted in Table 1. For detailed statistical analysis of this set of experiments see Additional file 1.
Figure 2
Figure 2
Expression of inflammasome components in rat cirrhotic fat storing cell line CFSC-2G subjected to LPS stimulation. CFSC-2G cells were treated one day after plating with 0, 50, 100 or 200 ng/ml LPS. After 30 min (A), 1 h (B), 2 hrs (C), 4 hrs (D), 8 hrs (E), 16 hrs (F), RNA from respective cells was extracted and, the expression of NLRP-1, NLRP-3. NLRC-4, AIM2, IL-1β, IL-18, ASC, and TNF-α analysed by qRT-PCR. In this analysis, the expression of each gene without LPS stimulation was set to 1. Please note, the high expression of TNF-α at early (inlets in B and C) and IL-1β (inlet in D) and medial time points after LPS treatment. For detailed statistical analysis of this set of experiments see Additional file 1.
Figure 3
Figure 3
Expression of inflammasome components in rat livers after bile duct ligation (BDL). (A) Sprague Dawley rats were subjected to BDL and sacrificed 2 (3 animals), 7 (5 animals) or 14 (5 animals) days after surgery. The livers of 5 untreated rats were taken as controls. RNA was isolated and the expression of NLRP-1, NLRP-3. NLRC4/NALP4, AIM2, IL-1β, IL-18, ASC, and TNF-α analyzed by qRT-PCR. In this analysis, the expression of the tested genes in livers of sham operated rats (control) was set to 1. (B, C, D) Kruskal-Wallis testing of NLRP-3 (B), NLRP-1 (C), and AIM2 (D) expression during ongoing fibrogenesis induced by the BDL surgery. For detailed statistical analysis of this set of experiments see Additional file 1.
Figure 4
Figure 4
Expression of inflammasome components in rat livers after application of CCl4. (A) Sprague Dawley rats received one single application of CCl4 or oil. 48 hrs later RNA was prepared and analyzed for expression of IL-1α, IL-1β, IL-6, IL-10, IL-18, IFN-γ, ASC, TNF-α, NLRP-1, NLRP-3, NLRC-4 and AIM2 by qRT-PCR. Details on primer combinations are given in Table 1. (B) The same set of RNAs from (A) was analyzed for expression of CCL-2. (C) The livers of Sprague Dawley rats (3 animals/group) that received one single (1x) or twice weekly intraperitoneal injections of 1 ml/kg BW of CCl4 in an equal volume of mineral oil for 1, 2, 4, 8, or 12 weeks were sampled, RNA extracted, and the expression of NLRP-3 (C), NLRP-1 (D), and AIM2 (E) analyzed by qRT-PCR. Representative melting curves for the expression studies of the three genes investigated are depicted in the lower panels. For detailed information about primer combinations and statistical analysis of this set of experiments see Table 1 and Additional file 1.
Figure 5
Figure 5
Hepatic expression of NLRP-3 and NLRP-1 in rats after administration of CCl4 or BDL surgery. Liver specimen from animals that received CCl4 or underwent BDL for indicated time points were stained with antibodies specific for NLRP-3 (A) or NLRP-1 (B). Section from control animals and a stain with an unspecific rabbit IgG served as controls in this analysis.
Figure 6
Figure 6
Hepatic expression of AIM2 and NALP4/NLRC4 in rats after administration of CCl4 or BDL surgery. Liver specimen from animals that received CCl4 or underwent BDL for indicated time points were stained with antibodies specific for AIM2 (A) or NALP4/NLRC4 (B). Section from control animals and a stain with an unspecific rabbit IgG served as controls in this analysis.
Figure 7
Figure 7
Influx of neutrophils, monocytes and other immune cells in livers of mice subjected to either BDL or CCl4 treatment. (A) Total number of leukocytes in liver cell extracts was identified by their positivity for CD45. (B) The numbers of monocytes and granulocytes were measured by their positivity for CD11b. (C) Macrophages were identified by their positivity for CD11b and F4/80. (D) The total number of neutrophils was measured by their positivity for Ly-6G. The analysis was done from livers of animals taken 5 days after BDL surgery and 48 h after single injection of CCl4.
Figure 8
Figure 8
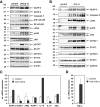
Expression of inflammasomes in mice after LPS and Con A injection. (A) Liver extracts were prepared from control mouse (4 animals) or animals that received intraperitoneal injection of LPS (2.5 μg/g body weight) for 2 (2 animals) or 6 hrs (5 animals). Equal protein amounts (100 μg) were then subjected to SDS-PAGE and analyzed in Western blot for expression of NLRP-3, Caspase 3, pNF-κB p65, total NF-κB p65, Lipocalin-2 (LCN2), pJNK, total JNK, pSTAT1, total STAT1, pSTAT3, total STAT3, GAPDH, and β-actin. A representative blot is shown for two controls and two animals that received LPS for 2 hrs. (B) Liver extracts were prepared from control mouse or animals that received intraperitoneal injection of Con A (20 μg/g body weight) for 8 hrs. Equal protein amounts were then subjected to SDS-PAGE and analyzed for expression of NLRP-3, Lipocalin-2 (LCN2), pJNK, total JNK, pSTAT1, total STAT1, pSTAT3, total STAT3, and GAPDH. The antibodies used in this study are given in Table 2. (C) RNA was isolated from livers of mice that were treated with Con A for 8 hrs or from 2 controls and 4 Con A-treated mice and analyzed for expression of NLRP-3, NLRC-4, AIM2, NLRP-1, IL-1β, IL-18, and ASC. (D) The same set of RNAs was tested for TNF-α expression. For detailed statistical analysis of this set of experiments see Additional file 1.
Figure 9
Figure 9
Expression of inflammasomes in primary murine hepatocytes after stimulation with LPS. Primary hepatocytes in culture were stimulated one day after isolation with 50, 100, 200 and 400 ng/ml LPS or left untreated. After indicated times (30 min, 1 h, 2 hrs, 4 hrs) RNA was isolated from respective cells and tested for expression of NLRP-1 (A), NLRP-3 (B), NLRC-4 (C), AIM2 (D), IL-1β (E), IL-18 (F), ASC (G), and TNF-α (H) by qRT-PCR. For detailed statistical analysis of this set of experiments see Additional file 1.

Similar articles

Cited by

References

    1. Martinon F, Burns K, Tschopp J. The inflammasome: a molecular platform triggering activation of inflammatory caspases and processing of proIL-β. Mol Cell. 2002;10:417–426. doi: 10.1016/S1097-2765(02)00599-3. - DOI - PubMed
    1. Martinon F, Mayor A, Tschopp J. The inflammasomes: guardians of the body. Annu Rev Immunol. 2009;27:229–265. doi: 10.1146/annurev.immunol.021908.132715. - DOI - PubMed
    1. Ting JP, Duncan JA, Lei Y. How the noninflammasome NLRs function in the innate immune system. Science. 2010;327:286–290. doi: 10.1126/science.1184004. - DOI - PMC - PubMed
    1. Schroder K, Tschopp J. The inflammasomes. Cell. 2010;140:821–832. doi: 10.1016/j.cell.2010.01.040. - DOI - PubMed
    1. Strowig T, Henao-Mejia J, Elinav E, Flavell R. Inflammasomes in health and disease. Nature. 2012;481:278–286. doi: 10.1038/nature10759. - DOI - PubMed

LinkOut - more resources