. 2012;7(11):e49970.
doi: 10.1371/journal.pone.0049970. Epub 2012 Nov 21.

Differential roles of fibroblast growth factor receptors (FGFR) 1, 2 and 3 in the regulation of S115 breast cancer cell growth

Affiliations

Differential roles of fibroblast growth factor receptors (FGFR) 1, 2 and 3 in the regulation of S115 breast cancer cell growth

Kati M Tarkkonen et al. PLoS One. 2012.

Abstract

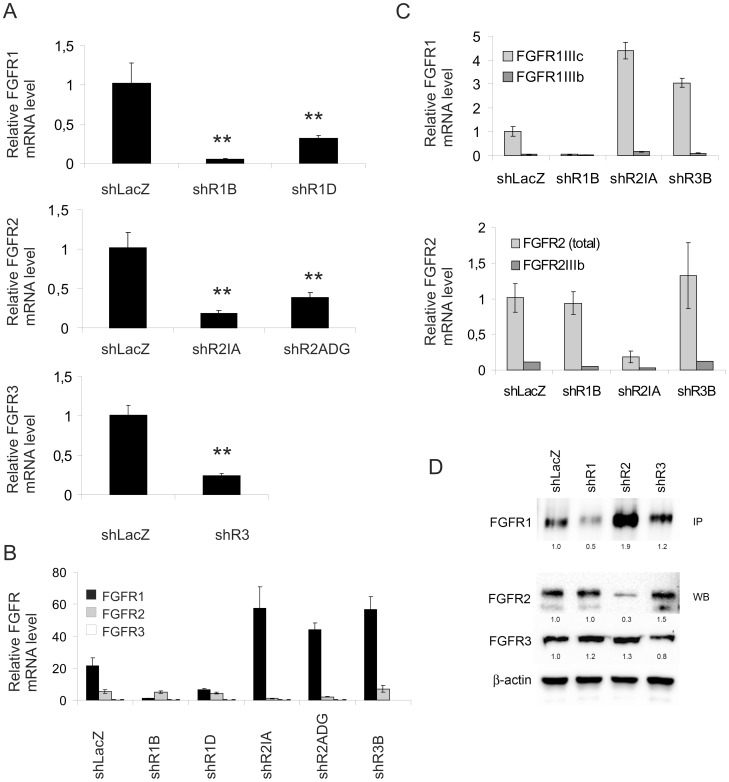
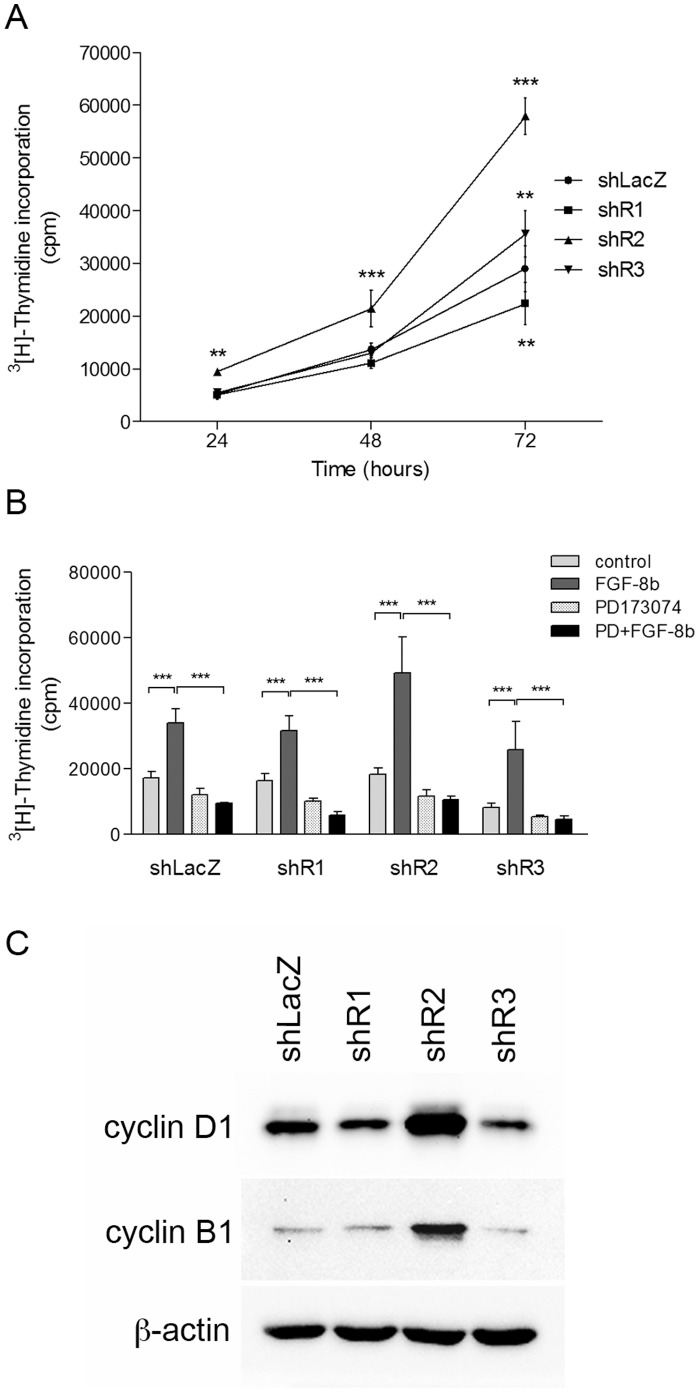
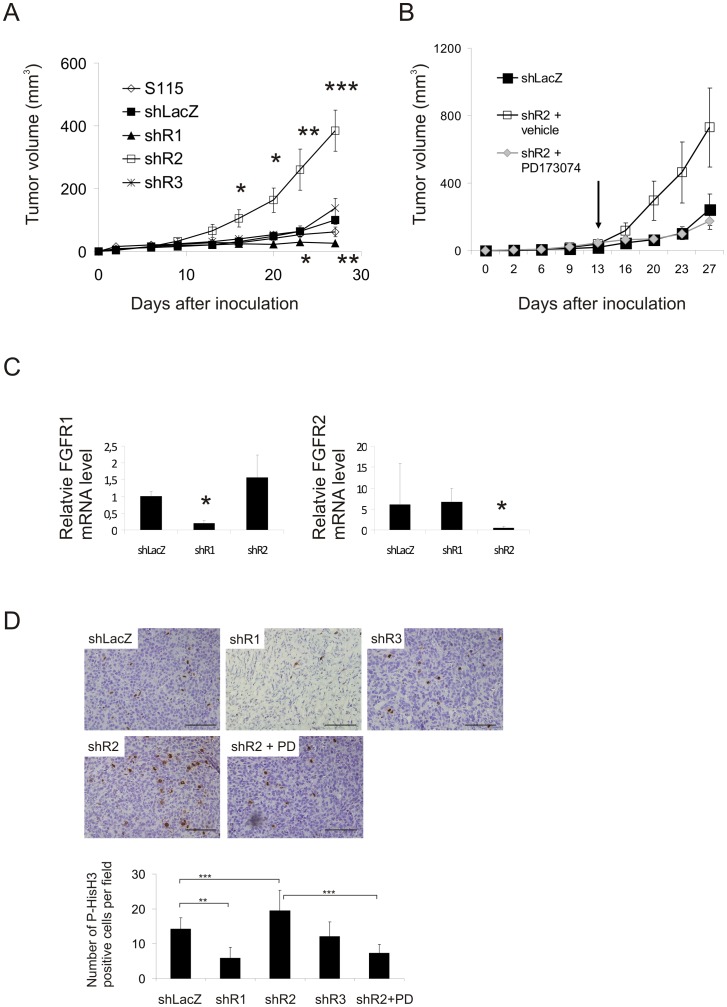
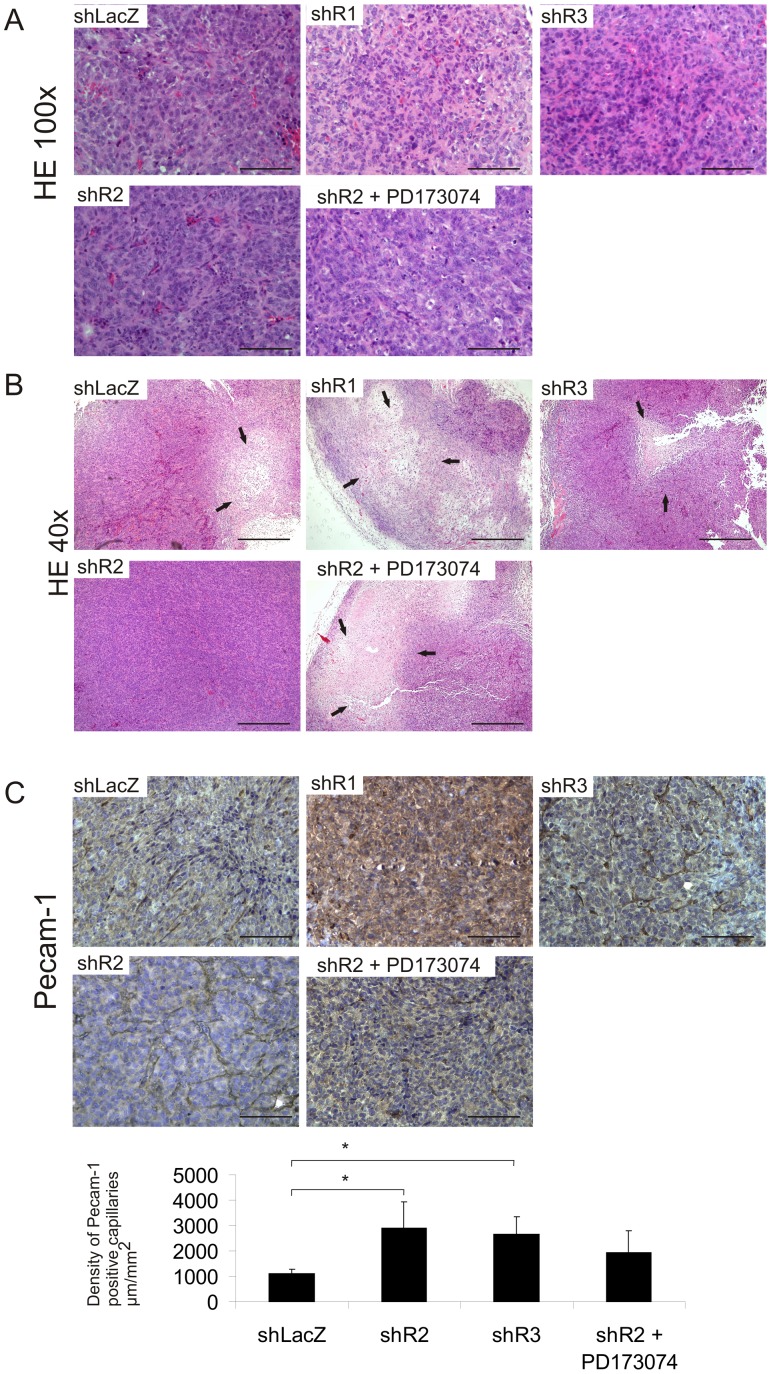
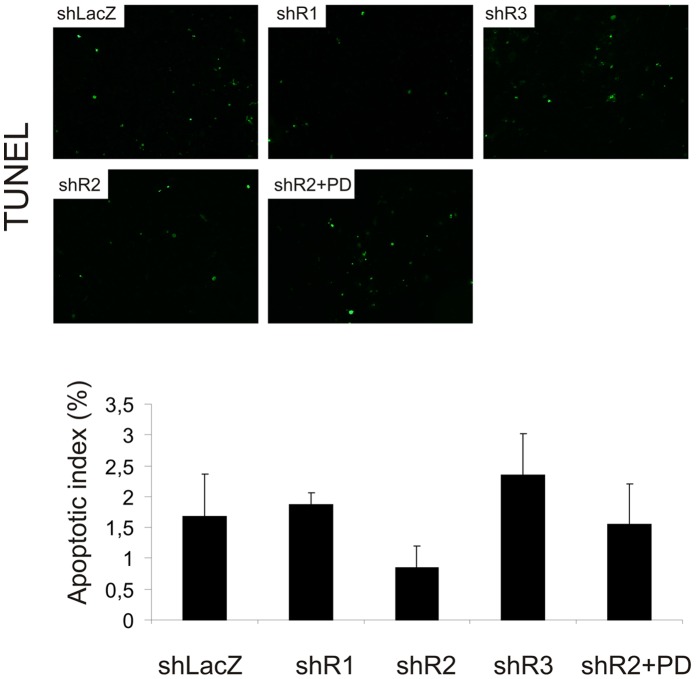
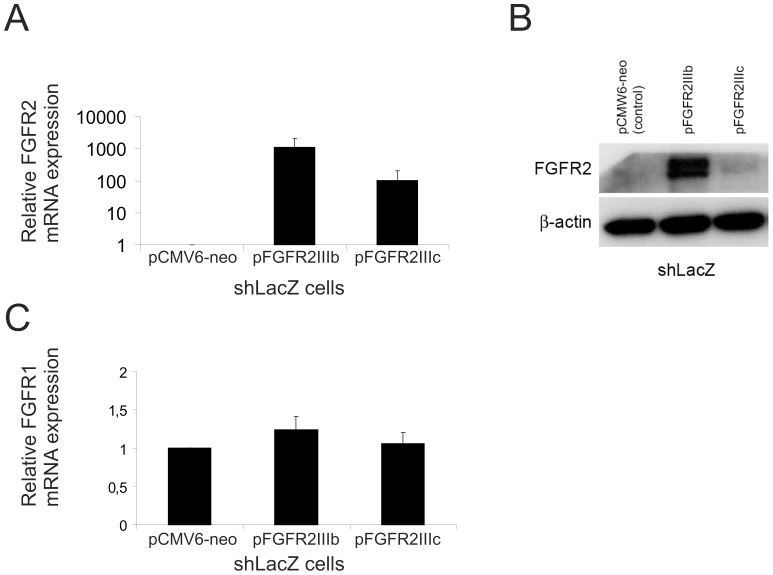
Fibroblast growth factors (FGFs) regulate the growth and progression of breast cancer. FGF signaling is transduced through FGF receptors 1-4, which have oncogenic or anti-oncogenic roles depending on the ligand and the cellular context. Our aim was to clarify the roles of FGFR1-3 in breast cancer cell growth in vitro and in vivo. Pools of S115 mouse breast cancer cells expressing shRNA against FGFR1, 2 and 3 were created by lentiviral gene transfer, resulting in cells with downregulated expression of FGFR1, FGFR2 or FGFR3 (shR1, shR2 and shR3 cells, respectively) and shLacZ controls. FGFR1-silenced shR1 cells formed small, poorly vascularized tumors in nude mice. Silencing of FGFR2 in shR2 cells was associated with strong upregulation of FGFR1 expression and the formation of large, highly vascularized tumors compared to the control tumors. Silencing FGFR3 did not affect cell survival or tumor growth. Overexpressing FGFR2 in control cells did not affect FGFR1 expression, suggesting that high FGFR1 expression in shR2 cells and tumors was associated with FGFR2 silencing by indirect mechanisms. The expression of FGFR1 was, however, increased by the addition of FGF-8 to starved shLacZ or MCF-7 cells and decreased by the FGFR inhibitor PD173074 in shR2 cells with an elevated FGFR1 level. In conclusion, our results demonstrate that FGFR1 is crucial for S115 breast cancer cell proliferation and tumor growth and angiogenesis, whereas FGFR2 and FGFR3 are less critical for the growth of these cells. The results also suggest that the expression of FGFR1 itself is regulated by FGF-8 and FGF signaling, which may be of importance in breast tumors expressing FGFs at a high level.


Conflict of interest statement

Competing Interests: Johanna Tuomela was employed by Pharmatest Services Ltd for a period during the study. There are no patents, products in development or marketed products to declare. This does not alter the authors' adherence to all the PLOS ONE policies on sharing data and materials.

Figures

Figure 1
Figure 1. FGFR1, 2 and 3 expression in FGFR-silenced S115 cells (sh cells).
Cells were grown in DMEM containing 4% iFBS and 10 nM testosterone. RNA and protein were extracted from three independently cultured sub-confluent cell plates and analyzed using qRT-PCR and immunoblotting, respectively. A) FGFR1-3 mRNA expression in the five original FGFR-silenced cell pools (shR1B, shR1D, shR2IA, shR2ADG and shR3B) compared to the expression level in control cells (shLacZ). FGFR mRNA expression is normalized to cyclophilin B expression. The statistical differences between mRNA levels were tested by non-parametric Mann-Whitney U-test, * P<0.05, ** P<0.01. B) Overall relative FGFR mRNA expression level in sh cells. C) Relative FGFR1IgIIIb/c and FGFR2IgIIIb/c mRNA expression in cells that were chosen for further studies (shR1B, shR2IA and shR3B). D) FGFR protein levels in shR1B, shR2IA and shR3B cells. Immunoprecipitation of FGFR1 was performed using 150 µg of whole cell lysates. Detection of FGFR2 and FGFR3 by western blotting was performed using 20 µg of whole cell lysates. FGFR1 expression in shR1, shR2 and shR3 cells is normalized to the protein expression in shLacZ cells. FGFR2 and FGFR3 expression in shR1, shR2 and shR3 cells are normalized to β-actin expression and thereafter to expression in shLacZ. A representative immunoblot of three independent experiments is shown.
Figure 2
Figure 2. Proliferation and cyclin expression of sh cells in vitro.
A) shLacZ, shR1, shR2 and shR3 cells were grown in full growth medium and cell proliferation was measured at 24 h intervals. Columns represent [3H]-thymidine incorporation, and data are expressed as mean ± SD cpm/well (n = 8). The experiment was repeated once, with similar results. B) Effect of the FGFR inhibitor PD173074 on FGF-8b-induced proliferation in sh cells analyzed by [3H]-thymidine incorporation. sh cells were pre-cultured in DC-FBS for 48 h and then treated with FGF-8b (25 ng/ml) and/or PD173074 or PBS vehicle for 48 h. The inhibitor was added 30 minutes before addition of FGF-8b. Data are expressed as mean ± SD cpm/well (n = 8). The statistical differences between groups were analyzed using one-way ANOVA followed by Bonferroni's multiple comparison test. * P<0.05, ** P<0.01, *** P<0.001. C) Cyclin D1 and cyclin B protein expression in untreated sh cells. Whole-cell lysates were generated from sh cells grown in full growth medium. Protein was subjected to SDS-PAGE and immunoblotted with antibodies against cyclin D1, cyclin B, 1 and β-actin. The experiment was repeated once, with similar results.
Figure 3
Figure 3. Growth of sh cells in nude mouse tumors.
1*106 cells were inoculated subcutaneously (s.c.) into male nude mice (n = 5–6). A) Tumor growth was monitored every 3–4 days with a caliper until the end of the experiment. Representative growth curves from one of the two experiments with similar results are shown. Mean ± SE from each group is shown. Statistical significance of the growth rate differences were tested by Repeated Measures ANOVA, * P<0.05, ** P<0.01, *** P<0.001. B) FGFR inhibitor PD173074 was administered to mice bearing shR2 cell tumors, starting from day 13 (indicated by an arrow), at a dose of 25 mg/kg 5 times/week until the end of the experiment. Mean ± SE from each group is shown. C) FGFR mRNA levels were quantified by qRT-PCR analysis from shLacZ, shR1 and shR2 tumors from a separate experiment, in which the tumors were grown for 8 weeks in nude mice. Statistical difference between mRNA levels were tested by independent sample t-test, * P<0.05. D) P-HisH3 immunohistochemical staining of shLacZ, shR1, shR2 and shR3 tumor sections (upper panel). Scale bar = 100 µm. Lower panel shows the number of P-HisH3-positive cells per field. P-HisH3-positive cells were counted in 5–15 fields per tumor section and each group contained six tumor sections. Statistical differences between groups were tested by ANOVA followed by Bonferroni's multiple comparison test, * P<0.05.
Figure 4
Figure 4. Morphology and vascularization of the sh cell tumors.
A) Morphology of shLacZ, shR1, shR2 and shR3 tumors visualized by H-E staining with 100× magnification, scale bar = 100 µm and B) 40× magnification, scale bar = 500 µm. Necrotic areas are indicated by arrows. C) Vascularization in tumors was demonstrated by Pecam-1 immunoreactivity. The upper panel shows representative photomicrographs of immunohistochemical Pecam-1 staining in shLacZ, shR1, shR2 and shR3 tumors, scale bar = 100 µm. The density of Pecam-1-positive capillaries was counted in a blinded manner from 3 fields per tumor, 4–6 tumors per group and is presented as graphs (lower panel). The difference in the number of positive capillaries between the shLacZ tumors and the other tumors was tested by ANOVA followed by Bonferroni's multiple comparison test, * P<0.05.
Figure 5
Figure 5. Apoptosis in sh cell tumors.
Apoptosis in tumor sections was evaluated using the TUNEL assay. The number of apoptotic cells (TUNEL-stained; upper panel) and the total number of cells (DAPI-stained; not shown) were counted to determine the percentage of apoptotic cells in the tumor sections (lower panel). Cells were counted from 3 (shR1) or 6 (shLacZ, shR2, shR3) tumors per group, 5–10 random fields in each section and data are expressed as mean ± SD.
Figure 6
Figure 6. FGF-induced ERK1/2 activation in sh cells.
Cells were pre-cultured in DC-FBS for 48 h and then treated with A) 25 ng/ml FGF-8b, B) 10 ng/ml FGF-2 or 100 ng/ml FGF-7 or PBS vehicle for indicated time periods. Whole-cell lysates were generated from cells and protein was subjected to SDS-PAGE and immunoblotted with antibodies against p-ERK1/2 and ERK1/2. The intensity of the bands was determined by scanning densitometry and is presented in columns as the p-ERK1/2 expression relative to ERK expression. The experiment was repeated twice with similar results.
Figure 7
Figure 7. Overexpression of FGFR2IgIIIb and FGFR2IgIIIc in shLacZ cells.
A) FGFR2 mRNA levels (relative to control-transfected cells (pCMV6-neo)) in FGFR2IgIIIb and FGFR2IgIIIc-transfected cells were analyzed by qRT-PCR. mRNA levels measured 24 h post-transfection are presented in a logarithmic scale. B) FGFR2 protein levels 24 h post-transfection shown by western blotting. C) Relative FGFR1 mRNA expression in FGFR2IgIIIb and FGFRIgIIIc-overexpressing cells 24 h post-transfection. The experiment was repeated twice with similar results.
Figure 8
Figure 8. Regulation of FGFR1 mRNA expression in sh cells and MCF-7 cells.
Expression of total FGFR1 or FGFR1IgIIIc was quantified by qRT-PCR in the cells cultured as follows: A) The cells grown in standard growth medium were treated with PD173074 for 24 h. B) The cells were grown without testosterone (Te) for 5 days and without serum for 48 h. C) The FGF-8b-overexpressing S115 cell lines (FGF8b1 and FGF8b14) and the transfection control cell lines (Mock1 and Mock3) were cultured in 4% DC-FBS in the absence of Te. D) shLacZ cells were grown without Te for 2 days and without serum for 24 h followed by treatment with FGF-8b (25 ng/ml) for 24 h. E) MCF-7 cells were grown in standard growth medium and treated similarly with FGF-8. The experiment was performed as triplicates and repeated twice with similar results. The statistical difference between the vehicle- and FGF-8b-treated cells was determined by independent sample t-test, * P<0.05.

Similar articles

Cited by

References

    1. Ornitz DM, Itoh N (2001) Fibroblast growth factors. Genome Biol 2(3): REVIEWS3005. - PMC - PubMed
    1. Goldfarb M (1996) Functions of fibroblast growth factors in vertebrate development. Cytokine Growth Factor Rev 7(4): 311–325. - PubMed
    1. Eswarakumar VP, Lax I, Schlessinger J (2005) Cellular signaling by fibroblast growth factor receptors. Cytokine Growth Factor Rev 16(2): 139–149. - PubMed
    1. Dailey L, Ambrosetti D, Mansukhani A, Basilico C (2005) Mechanisms underlying differential responses to FGF signaling. Cytokine Growth Factor Rev 16(2): 233–247. - PubMed
    1. Adnane J, Gaudray P, Dionne CA, Crumley G, Jaye M, et al. (1991) BEK and FLG, two receptors to members of the FGF family, are amplified in subsets of human breast cancers. Oncogene 6(4): 659–663. - PubMed

Publication types

MeSH terms

Substances

Grants and funding

This work was supported by grants from the Swedish Cancer Foundation, the Swedish Research Council, the Sigrid Jusélius Foundation, Finland, the Finnish Cultural Foundation and the Turku University Foundation. These funders did not have any role in study design, data collection and analysis, decision to publish, or preparation of the manuscript.