Review
. 2013 Jan;280(1):28-45.
doi: 10.1111/febs.12078. Epub 2012 Dec 17.

Cryo-electron microscopy--a primer for the non-microscopist

Affiliations
Review

Cryo-electron microscopy--a primer for the non-microscopist

Jacqueline L S Milne et al. FEBS J. 2013 Jan.

Abstract

Cryo-electron microscopy (cryo-EM) is increasingly becoming a mainstream technology for studying the architecture of cells, viruses and protein assemblies at molecular resolution. Recent developments in microscope design and imaging hardware, paired with enhanced image processing and automation capabilities, are poised to further advance the effectiveness of cryo-EM methods. These developments promise to increase the speed and extent of automation, and to improve the resolutions that may be achieved, making this technology useful to determine a wide variety of biological structures. Additionally, established modalities for structure determination, such as X-ray crystallography and nuclear magnetic resonance spectroscopy, are being routinely integrated with cryo-EM density maps to achieve atomic-resolution models of complex, dynamic molecular assemblies. In this review, which is directed towards readers who are not experts in cryo-EM methodology, we provide an overview of emerging themes in the application of this technology to investigate diverse questions in biology and medicine. We discuss the ways in which these methods are being used to study structures of macromolecular assemblies that range in size from whole cells to small proteins. Finally, we include a description of how the structural information obtained by cryo-EM is deposited and archived in a publicly accessible database.


Figures

Figure 1
Figure 1
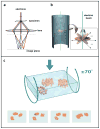
Image formation in the electron microscope. (a) Schematic illustrating image formation in an electron microscope, highlighting the similarities between electron and optical microscopy. (b) Schematic illustrating the principle of data collection for electron tomography. As the specimen is tilted relative to the electron beam, a series of images is taken of the same field of view. (c) Rendering of selected projection views generated during cryo-electron tomography as a vitrified film (formed by rapidly freezing a thin aqueous suspension) is tilted relative to the electron beam. To reconstruct the three-dimensional volume, a set of projection images is “smeared” out along the viewing directions to form back-projection profiles. The images are combined computationally to recover the density distribution of the object. Figure adapted from [110].
Figure 2
Figure 2
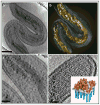
Use of cryo-electron tomography to image the interior architecture of intact bacterial cells. (a,b) Illustration of spiral architecture of the nucleoid in Bdellovibrio bacteriovorus showing (a) a 210 Å thick tomographic slice through the 3D volume of a cell and (b) a 3D surface rendering of the same cell, with the spiral nucleoid highlighted (yellow). (c) Higher magnification view of a tomographic slice through the cell, showing well-separated nucleoid spirals and ribosomes (dark dots) distributed at the edge of the nucleoid. (d) Expanded views of 210 Å thick tomographic slices, showing top-views of polar chemoreceptor arrays. A schematic model (inset) illustrates the spatial arrangement of the chemoreceptor arrays in the plane of the membrane. Scale bars: 2000 Å in (a) and 500 Å in (c,d). Figure adapted from [44].
Figure 3
Figure 3
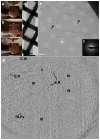
Imaging of vitreous sections by cryo-electron microscopy. (a) An EM grid is placed at the diamond knife-edge using tweezers with a bent tip. (b) A ribbon of vitreous sections (white arrowheads) is guided over the EM grid using an eyelash (white arrow) attached to a wooden dowel. (c) Once the ribbon of vitreous sections is of suitable length (white arrowheads), approximately the diameter of the EM grid, an electrostatic generator is switched from the discharge mode to the charge mode, causing the ribbon to attach to the EM grid. (d) A low magnification image showing the ribbon of vitreous sections after electrostatic charging. Scale bar: 50 μm. (e) A medium magnification micrograph showing a vitreous section from within the ribbon. Note that the section is smooth and relatively flat with no apparent mechanically induced damage as is often seen with stamping/pressing techniques. S. cerevisiae cells can be seen scattered throughout the vitreous section (black arrows). Holes within the C-Flat EM grid can be seen and one such is denoted with a white asterisk. Scale bar: 2 μm. (f) A selected area diffraction pattern confirming vitreous ice. (g) A 50 Å thick slice through a reconstructed tilt series from a 500 Å thick vitreous section of an S. cerevisiae cell: C.W. – Cell Wall, V – Vacuole, M – Mitochondrion, E.R. – pieces of Endoplasmic reticulum, RLPs – Ribosome-like particles. Scale bar: 1000 Å.
Figure 4
Figure 4
Structural analysis of membrane protein complexes using cryo-electron tomography combined with sub-volume averaging. (a) Tomographic slice through a field of HIV recorded from a specimen grid that was plunge-frozen and stored at liquid nitrogen temperatures. In this image, the viral membrane is decorated with trimeric envelope glycoproteins, which are required for viral entry into target cells. (b) Density map at ~ 20 Å resolution of the trimeric envelope glycoproteins complexed with the neutralizing antibody VRC01. The map was obtained by missing wedge-corrected, subvolume averaging of cryo-electron tomographic images. The map was then fitted with three copies of the X-ray crystallographically determined structure for the complex of monomeric gp120, a portion of the HIV envelope glycoprotein, complexed with VRC01. (c) Projection image of individual molecular complexes of soluble trimeric envelope glycoproteins from human immunodeficiency virus (HIV; strain KNH1144). (d) Density map at ~ 20 Å resolution of the complex of HIV envelope glycoproteins (molecular weight of polypeptide portion ~ 240 kDa) with soluble CD4 (molecular weight ~ 24 kDa) and Fab fragment (molecular weight ~ 50 kDa). The map is fitted with three copies of the structure of the ternary complex of monomeric gp120, sCD4 and 17b Fab determined by X-ray crystallography. Figure panels adapted from[73] and [74].
Figure 5
Figure 5
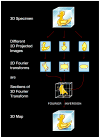
Principle of reconstruction of 3D structure by Fourier inversion. Using the “Fourier duck” as the prototypical biological specimen, the schematic illustrates that projection images of the object, each with a different orientation, have 2D Fourier transforms that correspond to sections (indicated by red arrows) through the 3D Fourier transform of the original object. Thus, once the 3D Fourier transform is built up from a collection of 2D images spanning a complete range of orientations, Fourier inversion enables recovery of the 3D structure.
Figure 6
Figure 6
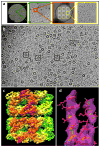
Automation of macromolecular assembly structure determination by cryo-EM single-particle analysis. (a) Images of a cryo-EM grid at sequentially higher magnification, beginning (left) with an image of the entire grid and concluding with an image of individual structures (right). (b) Representative projection image from a frozen-hydrated specimen of purified GroEL protein complexes. Complexes with distinct orientations relative to the electron beam can be discerned as indicated in the boxed examples. (c) 3D reconstruction using ~ 28,000 individual projection images such as those boxed in panel (b) to generate a density map of the complex at ~ 7 Å resolution. The initial 3D reconstruction was derived by sub-volume averaging using ~ 2000 GroEL particles. Refinement of the initial reconstruction was carried out using almost completely automated procedures as implemented in the software package FREALIGN [111] to refine the structure to ~ 7 Å resolution. (d) Demonstration that the resolution achieved is adequate to visualize α-helices, illustrated by the superposition of a density map of a region of the polypeptide with the corresponding region of a GroEL structure determined by X-ray crystallography (PDB ID: 3E76). Figure panels (b–d) adapted from Bartesaghi et al. (manuscript in preparation).
Figure 7
Figure 7
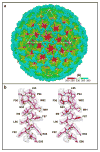
Determination of structure of a non-enveloped icosahedral virus using cryo-electron microscopy. Visualization of (a) entire structure and (b) selected region demonstrating that near-atomic resolution maps can be obtained for highly ordered assemblies such as icosahedral viruses using advanced image processing methods. Figure adapted from [19].
Figure 8
Figure 8
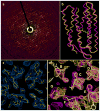
Determination of membrane protein structure using electron crystallography of 2D crystals. (a) Electron diffraction pattern from bacteriorhodopsin crystals, with reflections extending to ~ 2 Å. (b) Structures of bacteriorhodopsin in native and intermediate conformations at 3.2 Å resolution were obtained by combining phase information present in images of 2D crystals with amplitude information obtained from electron diffraction patterns. (c) σA-weighted density (2FO-FC) map of the open intermediate of bacteriorhodopsin in the center of a lipid bilayer. The map is fitted with the refined atomic model (PDB ID: 1FBK). (d) Sections of bacteriorhodopsin in wild-type (purple) and open intermediate (yellow) conformations, showing the helix movements (from magenta to yellow coordinates) at the cytoplasmic ends of transmembrane helices F and G. The location of the section is marked by the white arrow at the left edge of (b)). The maps are superimposed on the structure of wild-type bacteriorhodopsin, derived by cryo-electron microscopy at 3.2 Å resolution. Figure adapted from [16].
Figure 9
Figure 9
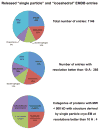
Distribution of released entries belonging to the “single-particle” and “icosahedral” categories in the Electron Microscopy Data Bank (emdb.org) as of June 2012. Structures from ribosomes and icosahedral viruses dominate the deposited entries, both in the entire data set, and even more strikingly, in the subset of entries with resolutions better than 10 Å. Further inspection shows that there are only four distinct protein complexes with molecular masses < 500 kDa (Multiprotein splicing factor SF3B: EMD-1043; DegQ: EMD-5290; E. coli cascade complex: EMD-5314 and EMD-5315; N-ethylmaleimide-sensitive factor: EMD-5370 and EMD-5371), thus identifying a key gap in structural biology that can potentially be filled by taking advantage of improvements in microscope hardware and algorithms for image processing.

Similar articles

Cited by

References

    1. Hoenger A, Bouchet-Marquis C. Cellular tomography. Adv Protein Chem Struct Biol. 2011;82:67–90. - PubMed
    1. Hurbain I, Sachse M. The future is cold: cryo-preparation methods for transmission electron microscopy of cells. Biol Cell. 2011;103:405–20. - PubMed
    1. Milne JL, Subramaniam S. Cryo-electron tomography of bacteria: progress, challenges and future prospects. Nat Rev Microbiol. 2009;7:666–75. - PMC - PubMed
    1. Tocheva EI, Li Z, Jensen GJ. Electron cryotomography. Cold Spring Harb Perspect Biol. 2010;2:a003442. - PMC - PubMed
    1. Pierson J, Vos M, McIntosh JR, Peters PJ. Perspectives on electron cryotomography of vitreous cryo-sections. J Electron Microsc (Tokyo) 2011;60(Suppl 1):S93–100. - PMC - PubMed

Publication types