Absence of glucose transporter 4 diminishes electrical activity of mouse hearts during hypoxia
- PMID: 23180812
- PMCID: PMC6599691
- DOI: 10.1113/expphysiol.2012.070235
Absence of glucose transporter 4 diminishes electrical activity of mouse hearts during hypoxia
Abstract
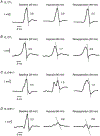
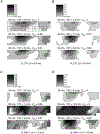
Insulin resistance, which characterizes type 2 diabetes, is associated with reduced translocation of glucose transporter 4 (GLUT4) to the plasma membrane following insulin stimulation, and diabetic patients with insulin resistance show a higher incidence of ischaemia, arrhythmias and sudden cardiac death. The aim of this study was to examine whether GLUT4 deficiency leads to more severe alterations in cardiac electrical activity during cardiac stress due to hypoxia. To fulfil this aim, we compared cardiac electrical activity from cardiac-selective GLUT4-ablated (G4H-/-) mouse hearts and corresponding control (CTL) littermates. A custom-made cylindrical 'cage' electrode array measured potentials (Ves) from the epicardium of isolated, perfused mouse hearts. The normalized average of the maximal downstroke of Ves ( (|d Ves/dt(min)|na), which we previously introduced as an index of electrical activity in normal, ischaemic and hypoxic hearts, was used to assess the effects of GLUT4 deficiency on electrical activity. The |d Ves/dt(min)|na of G4H −/− and CTL hearts decreased by 75 and 47%, respectively (P < 0.05), 30 min after the onset of hypoxia. Administration of insulin attenuated decreases in values of |d Ves/dt(min)|na in G4H −/− hearts as well as in CTL hearts, during hypoxia. In general, however, G4H −/− hearts showed a severe alteration of the propagation sequence and a prolonged total activation time. Results of this study demonstrate that reduced glucose availability associated with insulin resistance and a reduction in GLUT4-mediated glucose transport impairs electrical activity during hypoxia, and may contribute to cardiac vulnerability to arrhythmias in diabetic patients.
Figures


Similar articles
-
The maximal downstroke of epicardial potentials as an index of electrical activity in mouse hearts.IEEE Trans Biomed Eng. 2011 Nov;58(11):3175-83. doi: 10.1109/TBME.2011.2164075. Epub 2011 Aug 18. IEEE Trans Biomed Eng. 2011. PMID: 21859611
-
Glucose transporter 4-deficient hearts develop maladaptive hypertrophy in response to physiological or pathological stresses.Am J Physiol Heart Circ Physiol. 2017 Dec 1;313(6):H1098-H1108. doi: 10.1152/ajpheart.00101.2017. Epub 2017 Aug 19. Am J Physiol Heart Circ Physiol. 2017. PMID: 28822962 Free PMC article.
-
Regulation of insulin-responsive aminopeptidase expression and targeting in the insulin-responsive vesicle compartment of glucose transporter isoform 4-deficient cardiomyocytes.Mol Endocrinol. 2004 Oct;18(10):2491-501. doi: 10.1210/me.2004-0175. Epub 2004 Jul 1. Mol Endocrinol. 2004. PMID: 15231875
-
Responses of GLUT4-deficient hearts to ischemia underscore the importance of glycolysis.Circulation. 2001 Jun 19;103(24):2961-6. doi: 10.1161/01.cir.103.24.2961. Circulation. 2001. PMID: 11413087
-
Acute and chronic signals controlling glucose transport in skeletal muscle.J Cell Biochem. 1992 Jan;48(1):51-60. doi: 10.1002/jcb.240480109. J Cell Biochem. 1992. PMID: 1583073 Review.
Cited by
-
Trauma, a Matter of the Heart-Molecular Mechanism of Post-Traumatic Cardiac Dysfunction.Int J Mol Sci. 2021 Jan 13;22(2):737. doi: 10.3390/ijms22020737. Int J Mol Sci. 2021. PMID: 33450984 Free PMC article. Review.
-
Cardiac Depression in Pigs after Multiple Trauma - Characterization of Posttraumatic Structural and Functional Alterations.Sci Rep. 2017 Dec 19;7(1):17861. doi: 10.1038/s41598-017-18088-1. Sci Rep. 2017. PMID: 29259232 Free PMC article.
-
New Molecular Insights of Insulin in Diabetic Cardiomyopathy.Front Physiol. 2016 Apr 12;7:125. doi: 10.3389/fphys.2016.00125. eCollection 2016. Front Physiol. 2016. PMID: 27148064 Free PMC article. Review.
-
Inhibition of sarcolemmal FAT/CD36 by sulfo-N-succinimidyl oleate rapidly corrects metabolism and restores function in the diabetic heart following hypoxia/reoxygenation.Cardiovasc Res. 2017 Jun 1;113(7):737-748. doi: 10.1093/cvr/cvx045. Cardiovasc Res. 2017. PMID: 28419197 Free PMC article.
-
Plant-derived glucose transport inhibitors with potential antitumor activity.Phytother Res. 2020 May;34(5):1027-1040. doi: 10.1002/ptr.6587. Epub 2019 Dec 10. Phytother Res. 2020. PMID: 31823431 Free PMC article. Review.
References
-
- Abel ED (2004). Glucose transport in the heart. Front Biosci 9,201–215. - PubMed
-
- Abel ED (2005). Myocardial insulin resistance and cardiac complications of diabetes. Curr Drug Targets Immune Endocr Metabol Disord 5, 219–226. - PubMed
-
- Abel ED, Kaulbach HC, Tian R, Hopkins JC, Duffy J,Doetschman T, Minnemann T, Boers ME, Hadro E, Oberste-Berghaus C, Quist W, Lowell BB, Ingwall JS & Kahn BB (1999). Cardiac hypertrophy with preserved contractile function after selective deletion of GLUT4 from the heart. J Clin Invest 104, 1703–1714. - PMC - PubMed
-
- Arya DS, Bansal P, Ojha SK, Nandave M, Mohanty I & Gupta SK (2006). Pyruvate provides cardioprotection in the experimental model of myocardial ischemic reperfusion injury. Life Sci 79, 38–44. - PubMed
-
- Aulbach F, Simm A, Maier S, Langenfeld H, Walter U, Kersting U & Kirstein M (1999). Insulin stimulates the L-type Ca2+current in rat cardiac myocytes. Cardiovasc Res 42, 113–120. - PubMed
Publication types
MeSH terms
Substances
Grants and funding
LinkOut - more resources
Full Text Sources
Other Literature Sources

