

Age-associated changes in gene expression in human brain and isolated neurons
- PMID: 23177596
- PMCID: PMC3545059
- DOI: 10.1016/j.neurobiolaging.2012.10.021
Age-associated changes in gene expression in human brain and isolated neurons
Abstract
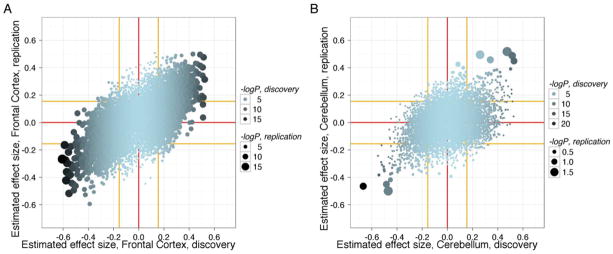
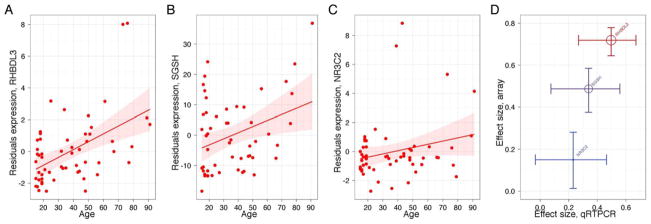
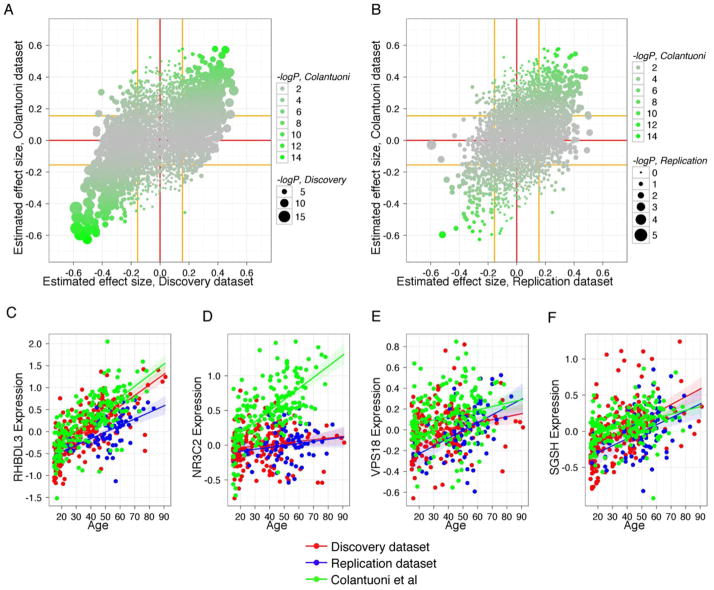
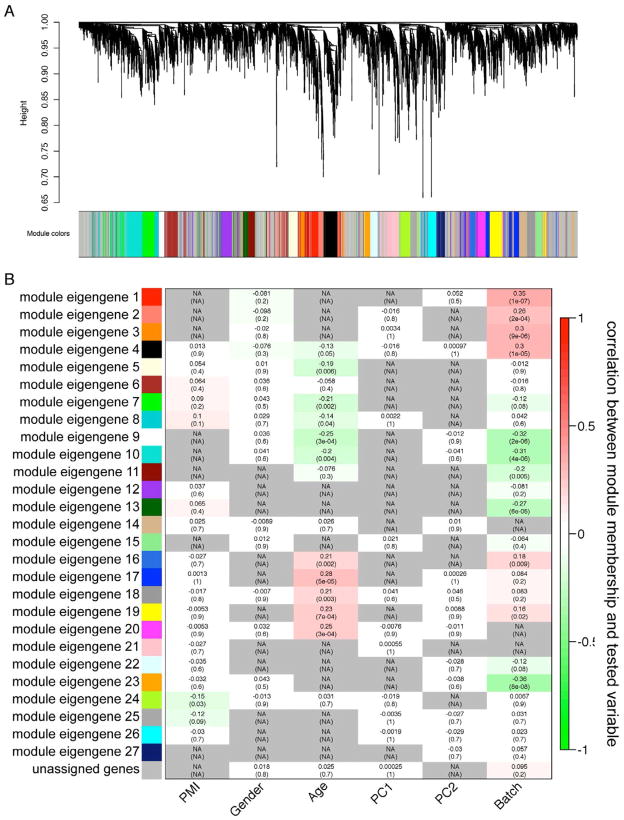
Previous studies have suggested that there are genes whose expression levels are associated with chronological age. However, which genes show consistent age association across studies, and which are specific to a given organism or tissue remains unresolved. Here, we reassessed this question using 2 independently ascertained series of human brain samples from 2 anatomic regions, the frontal lobe of the cerebral cortex and cerebellum. Using microarrays to estimate gene expression, we found 60 associations between expression and chronological age that were statistically significant and were replicated in both series in at least 1 tissue. There were a greater number of significant associations in the frontal cortex compared with the cerebellum. We then repeated the analysis in a subset of samples using laser capture microdissection to isolate Purkinje neurons from the cerebellum. We were able to replicate 5 gene associations from either frontal cortex or cerebellum in the Purkinje cell dataset, suggesting that there is a subset of genes which have robust changes with aging. Of these, the most consistent and strongest association was with expression of RHBDL3, a rhomboid protease family member. We confirmed several hits using an independent technique (quantitative reverse transcriptase polymerase chain reaction) and in an independent published sample series that used a different array platform. We also interrogated larger patterns of age-related gene expression using weighted gene correlation network analysis. We found several modules that showed significant associations with chronological age and, of these, several that showed negative associations were enriched for genes encoding components of mitochondria. Overall, our results show that there is a distinct and reproducible gene signature for aging in the human brain.
Published by Elsevier Inc.
Figures

Similar articles
-
Re-exploring the core genes and modules in the human frontal cortex during chronological aging: insights from network-based analysis of transcriptomic studies.Aging (Albany NY). 2018 Oct 20;10(10):2816-2831. doi: 10.18632/aging.101589. Aging (Albany NY). 2018. PMID: 30341976 Free PMC article.
-
Spatio-temporal characterization of the pleiotrophinergic system in mouse cerebellum: evidence for its key role during ontogenesis.Exp Neurol. 2013 Sep;247:537-51. doi: 10.1016/j.expneurol.2013.02.004. Epub 2013 Feb 20. Exp Neurol. 2013. PMID: 23454176
-
Transcriptomic landscape, gene signatures and regulatory profile of aging in the human brain.Biochim Biophys Acta Gene Regul Mech. 2020 Jun;1863(6):194491. doi: 10.1016/j.bbagrm.2020.194491. Epub 2020 Feb 8. Biochim Biophys Acta Gene Regul Mech. 2020. PMID: 32006715
-
Age-Related Changes in Lipidome of Rat Frontal Cortex and Cerebellum Are Partially Reversed by Methionine Restriction Applied in Old Age.Int J Mol Sci. 2021 Nov 20;22(22):12517. doi: 10.3390/ijms222212517. Int J Mol Sci. 2021. PMID: 34830402 Free PMC article.
-
Novel clinical associations with specific C9ORF72 transcripts in patients with repeat expansions in C9ORF72.Acta Neuropathol. 2015 Dec;130(6):863-76. doi: 10.1007/s00401-015-1480-6. Epub 2015 Oct 5. Acta Neuropathol. 2015. PMID: 26437865 Free PMC article.
Cited by
-
MicroRNAs in the aging female brain: a putative mechanism for age-specific estrogen effects.Endocrinology. 2013 Aug;154(8):2795-806. doi: 10.1210/en.2013-1230. Epub 2013 May 29. Endocrinology. 2013. PMID: 23720423 Free PMC article.
-
A cell epigenotype specific model for the correction of brain cellular heterogeneity bias and its application to age, brain region and major depression.Epigenetics. 2013 Mar;8(3):290-302. doi: 10.4161/epi.23924. Epub 2013 Feb 20. Epigenetics. 2013. PMID: 23426267 Free PMC article.
-
Transcriptomic profiling of the human brain reveals that altered synaptic gene expression is associated with chronological aging.Sci Rep. 2017 Dec 4;7(1):16890. doi: 10.1038/s41598-017-17322-0. Sci Rep. 2017. PMID: 29203886 Free PMC article.
-
Functional transcriptional signatures for tumor-type-agnostic phenotype prediction.bioRxiv [Preprint]. 2024 Mar 12:2023.04.12.536595. doi: 10.1101/2023.04.12.536595. bioRxiv. 2024. Update in: Sci Rep. 2024 Nov 8;14(1):27230. doi: 10.1038/s41598-024-76625-1. PMID: 37090606 Free PMC article. Updated. Preprint.
-
Integrative genomics approach identifies conserved transcriptomic networks in Alzheimer's disease.Hum Mol Genet. 2020 Oct 10;29(17):2899-2919. doi: 10.1093/hmg/ddaa182. Hum Mol Genet. 2020. PMID: 32803238 Free PMC article.
References
-
- Lu T, Pan Y, Kao SY, Li C, Kohane I, Chan J, et al. Gene regulation and DNA damage in the ageing human brain. Nature. 2004;429:883–891. - PubMed
Publication types
MeSH terms
Substances
Associated data
- Actions
- Actions
Grants and funding
LinkOut - more resources
Full Text Sources
Other Literature Sources
Medical
Molecular Biology Databases
