

The rs1024611 regulatory region polymorphism is associated with CCL2 allelic expression imbalance
- PMID: 23166687
- PMCID: PMC3500309
- DOI: 10.1371/journal.pone.0049498
The rs1024611 regulatory region polymorphism is associated with CCL2 allelic expression imbalance
Abstract
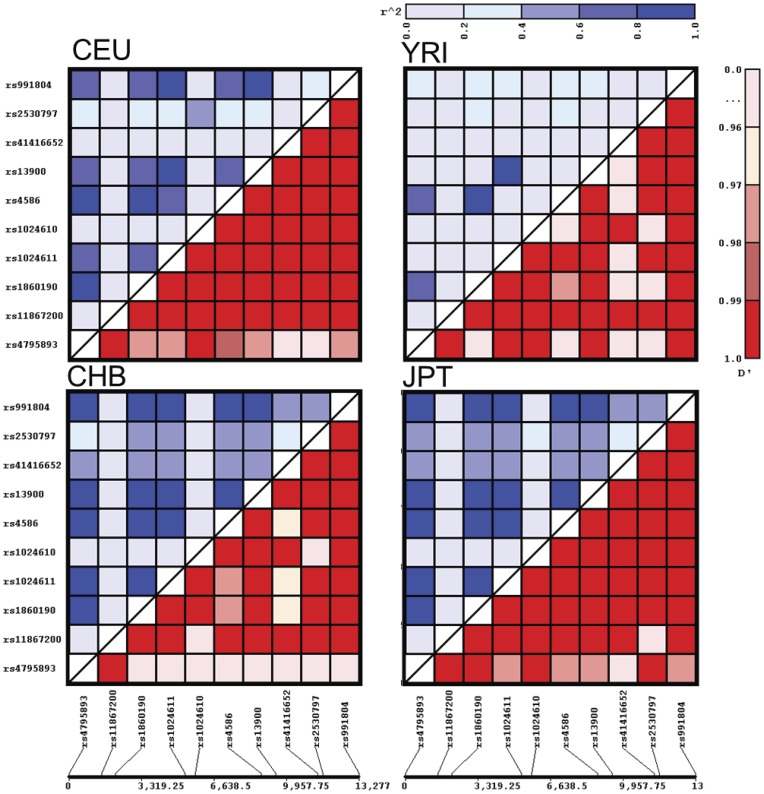
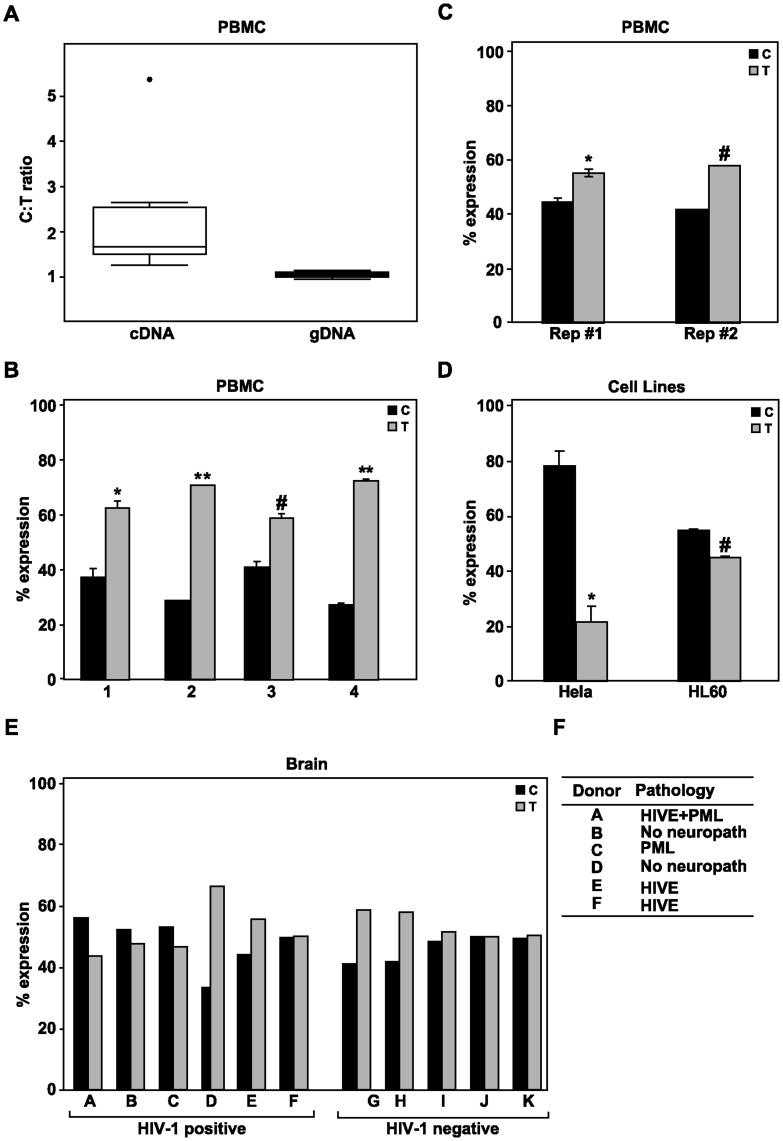
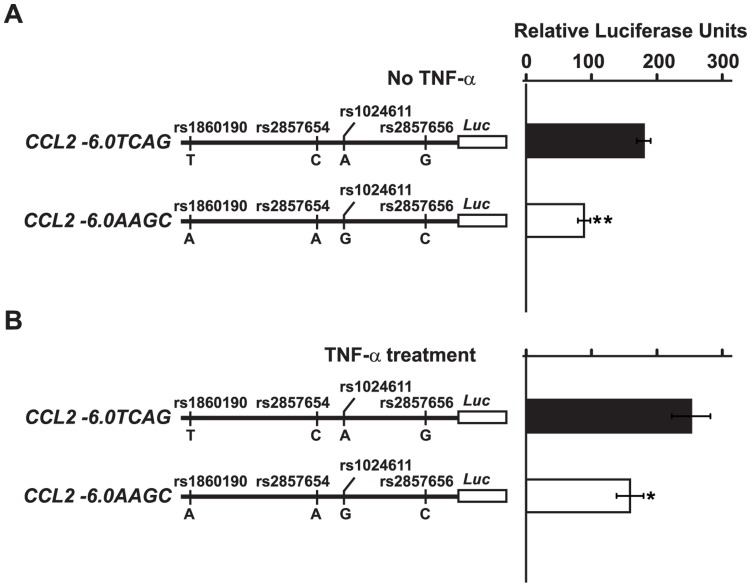
CC chemokine ligand 2 (CCL2) is the most potent monocyte chemoattractant and inter-individual differences in its expression level have been associated with genetic variants mapping to the cis-regulatory regions of the gene. An A to G polymorphism in the CCL2 enhancer region at position -2578 (rs1024611; A>G), was found in most studies to be associated with higher serum CCL2 levels and increased susceptibility to a variety of diseases such as HIV-1 associated neurological disorders, tuberculosis, and atherosclerosis. However, the precise mechanism by which rs1024611influences CCL2 expression is not known. To address this knowledge gap, we tested the hypothesis that rs1024611G polymorphism is associated with allelic expression imbalance (AEI) of CCL2. We used haplotype analysis and identified a transcribed SNP in the 3'UTR (rs13900; C>T) can serve as a proxy for the rs1024611 and demonstrated that the rs1024611G allele displayed a perfect linkage disequilibrium with rs13900T allele. Allele-specific transcript quantification in lipopolysaccharide treated PBMCs obtained from heterozygous donors showed that rs13900T allele were expressed at higher levels when compared to rs13900C allele in all the donors examined suggesting that CCL2 is subjected to AEI and that that the allele containing rs1024611G is preferentially transcribed. We also found that AEI of CCL2 is a stable trait and could be detected in newly synthesized RNA. In contrast to these in vivo findings, in vitro assays with haplotype-specific reporter constructs indicated that the haplotype bearing rs1024611G had a lower or similar transcriptional activity when compared to the haplotype containing rs1024611A. This discordance between the in vivo and in vitro expression studies suggests that the CCL2 regulatory region polymorphisms may be functioning in a complex and context-dependent manner. In summary, our studies provide strong functional evidence and a rational explanation for the phenotypic effects of the CCL2 rs1024611G allele.
Conflict of interest statement
Figures

Similar articles
-
Functional characterization of the disease-associated CCL2 rs1024611G-rs13900T haplotype: The role of the RNA-binding protein HuR.bioRxiv [Preprint]. 2023 Nov 2:2023.10.31.564937. doi: 10.1101/2023.10.31.564937. bioRxiv. 2023. PMID: 37961304 Free PMC article. Preprint.
-
Exploring the Role of C-C Motif Chemokine Ligand-2 Single Nucleotide Polymorphism in Pulmonary Tuberculosis: A Genetic Association Study from North India.J Immunol Res. 2020 Dec 16;2020:1019639. doi: 10.1155/2020/1019639. eCollection 2020. J Immunol Res. 2020. PMID: 33381602 Free PMC article.
-
Regulation of CCL2 expression by an upstream TALE homeodomain protein-binding site that synergizes with the site created by the A-2578G SNP.PLoS One. 2011;6(7):e22052. doi: 10.1371/journal.pone.0022052. Epub 2011 Jul 8. PLoS One. 2011. PMID: 21760952 Free PMC article.
-
Cis-acting regulatory variation in the human genome.Science. 2004 Oct 22;306(5696):647-50. doi: 10.1126/science.1101659. Science. 2004. PMID: 15499010 Review.
-
Regulatory polymorphisms underlying complex disease traits.J Mol Med (Berl). 2005 Feb;83(2):97-109. doi: 10.1007/s00109-004-0603-7. Epub 2004 Dec 9. J Mol Med (Berl). 2005. PMID: 15592805 Free PMC article. Review.
Cited by
-
Functional characterization of the disease-associated CCL2 rs1024611G-rs13900T haplotype: The role of the RNA-binding protein HuR.bioRxiv [Preprint]. 2023 Nov 2:2023.10.31.564937. doi: 10.1101/2023.10.31.564937. bioRxiv. 2023. PMID: 37961304 Free PMC article. Preprint.
-
Association Between Monocyte Chemotactic Protein 1 Variants and Age-Related Macular Degeneration Onset Among Chinese People.Med Sci Monit. 2020 Jun 2;26:e921584. doi: 10.12659/MSM.921584. Med Sci Monit. 2020. PMID: 32485729 Free PMC article.
-
The rs1024611 in the CCL2 gene and risk of gynecological cancer in Asians: a meta-analysis.World J Surg Oncol. 2018 Feb 20;16(1):34. doi: 10.1186/s12957-018-1335-4. World J Surg Oncol. 2018. PMID: 29458367 Free PMC article.
-
The CC chemokine ligand 2 (CCL2) polymorphism -2518A/G is associated with gout in the Chinese Han male population.Rheumatol Int. 2015 Mar;35(3):479-84. doi: 10.1007/s00296-014-3102-3. Epub 2014 Aug 14. Rheumatol Int. 2015. PMID: 25119828
-
An intronic PICALM polymorphism, rs588076, is associated with allelic expression of a PICALM isoform.Mol Neurodegener. 2014 Aug 29;9:32. doi: 10.1186/1750-1326-9-32. Mol Neurodegener. 2014. PMID: 25169757 Free PMC article.
References
-
- Melgarejo E, Medina MA, Sanchez-Jimenez F, Urdiales JL (2009) Monocyte chemoattractant protein-1: a key mediator in inflammatory processes. Int J Biochem Cell Biol 41: 998–1001. - PubMed
-
- Yadav A, Saini V, Arora S (2010) MCP-1: chemoattractant with a role beyond immunity: a review. Clin Chim Acta 411: 1570–1579. - PubMed
-
- Charo IF, Ransohoff RM (2006) The many roles of chemokines and chemokine receptors in inflammation. N Engl J Med 354: 610–621. - PubMed
Publication types
MeSH terms
Substances
Grants and funding
- U01 MH083507/MH/NIMH NIH HHS/United States
- R24 MH059724/MH/NIMH NIH HHS/United States
- U01 MH083500/MH/NIMH NIH HHS/United States
- R24 NS038841/NS/NINDS NIH HHS/United States
- IK2 BX001276/BX/BLRD VA/United States
- U01MH083501/MH/NIMH NIH HHS/United States
- U01 MH083501/MH/NIMH NIH HHS/United States
- U01MH083507/MH/NIMH NIH HHS/United States
- NS38841/NS/NINDS NIH HHS/United States
- 5U01MH083500/MH/NIMH NIH HHS/United States
- I01 BX000975/BX/BLRD VA/United States
- R24MH59724/MH/NIMH NIH HHS/United States
- U01 MH083545/MH/NIMH NIH HHS/United States
- R24 NS 38841/NS/NINDS NIH HHS/United States
LinkOut - more resources
Full Text Sources
Miscellaneous
