. 2012;8(11):e1003036.
doi: 10.1371/journal.pgen.1003036. Epub 2012 Nov 15.

Controls of nucleosome positioning in the human genome

Affiliations

Controls of nucleosome positioning in the human genome

Daniel J Gaffney et al. PLoS Genet. 2012.

Abstract

Nucleosomes are important for gene regulation because their arrangement on the genome can control which proteins bind to DNA. Currently, few human nucleosomes are thought to be consistently positioned across cells; however, this has been difficult to assess due to the limited resolution of existing data. We performed paired-end sequencing of micrococcal nuclease-digested chromatin (MNase-seq) from seven lymphoblastoid cell lines and mapped over 3.6 billion MNase-seq fragments to the human genome to create the highest-resolution map of nucleosome occupancy to date in a human cell type. In contrast to previous results, we find that most nucleosomes have more consistent positioning than expected by chance and a substantial fraction (8.7%) of nucleosomes have moderate to strong positioning. In aggregate, nucleosome sequences have 10 bp periodic patterns in dinucleotide frequency and DNase I sensitivity; and, across cells, nucleosomes frequently have translational offsets that are multiples of 10 bp. We estimate that almost half of the genome contains regularly spaced arrays of nucleosomes, which are enriched in active chromatin domains. Single nucleotide polymorphisms that reduce DNase I sensitivity can disrupt the phasing of nucleosome arrays, which indicates that they often result from positioning against a barrier formed by other proteins. However, nucleosome arrays can also be created by DNA sequence alone. The most striking example is an array of over 400 nucleosomes on chromosome 12 that is created by tandem repetition of sequences with strong positioning properties. In summary, a large fraction of nucleosomes are consistently positioned--in some regions because they adopt favored sequence positions, and in other regions because they are forced into specific arrangements by chromatin remodeling or DNA binding proteins.


Conflict of interest statement

The authors have declared that no competing interests exist.

Figures

Figure 1
Figure 1. Fine scale characteristics of nucleosome sequences.
A. Frequencies of AA/AT/TA/TT and CC/CG/GC/GG dinucleotides across nucleosome sequences normalized by expected dinucleotide frequencies (log2 ratio). Expected frequencies were taken from a set of simulated fragments, which were sampled such that they had the same MNase cutting bias as the observed fragments. B. DNase I cut rates across nucleosome sequences normalized by the expected cut rates (log2 ratio). Expected DNase I cut frequencies were estimated from the composition of all observed DNase I cut sites in the human genome. C. MNase-seq fragment midpoints from 3 cell lines. Expected midpoint frequencies were estimated from the same simulated fragments used in A.
Figure 2
Figure 2. Quantifying translational nucleosome positioning in the human genome.
A. Distribution of nucleosome positioning scores from a random sample of one million 200 bp regions (smoothed using a Gaussian kernel with bandwidth 0.01). Scores were also calculated in the same regions using midpoints from non-duplicate read pairs and from simulated read pairs. B. Distribution of nucleosome array log likelihood ratios (LLRs) for 23,763 randomly sampled 1 kb regions (smoothed using a Gaussian kernel with bandwidth 1.0). LLRs were also calculated using midpoints from simulated reads and using permuted versions of the same regions. C. Heatmap of MNase midpoints in the randomly sampled regions from B, prior to their alignment. D. Heatmap of MNase midpoints from panel D, after their alignment. Regions were aligned according to the most likely position of the central nucleosome. E. Heatmap of aligned MNase midpoints for permuted regions. Heatmaps in C, D, and E are ordered by the LLR of the observed midpoints.
Figure 3
Figure 3. Examples of nucleosome arrays.
A. MNase midpoint density (smoothed using a 30 bp sliding window) across a 76 kb region near the chromosome 12 centromere. This region contains an array of ∼400 nucleosomes with regular, consistent positioning. B. A small 10 kb subsection of the larger nucleosome array. Predicted nucleosome occupancy from the in vitro sequence model of Kaplan et al. corresponds very well with MNase midpoint density. Kaplan scores predict the affinity of nucleosomes for the sequence but, unlike predicted occupancies, do not incorporate steric exclusion. DNase I nick density (smoothed with a 10 bp sliding window) indicates the location of DNase I sensitive regions (there are none in this region). The density of simulated MNase midpoints and Yoruba DNA sequencing read depth (aggregated across individuals from the 1000 genomes project) are not strongly correlated with MNase midpoint density, which shows that the array is not an artifact of sequencing or mapping bias. C. MNase midpoint density around the gene NPM3. In this region there is consistent, regular spacing of nucleosomes, but their positions are not well predicted by the Kaplan model, particularly in the DNase I hypersensitive sites, which are depleted of nucleosomes.
Figure 4
Figure 4. Arrays of positioned nucleosomes flanking transcription factor (TF) binding sites.
A. Heatmaps of MNase midpoints (columns 1–2) and DNase I cuts (column 3) surrounding 1000 randomly sampled ChIP-seq peaks for CTCF, NF-kB, Irf4, GABP and C-fos. Heatmap rows are ordered from top to bottom by the nucleosome array log likelihood ratio (LLR). Columns 2 and 3 are aligned according to the most likely location of the upstream and downstream arrays of positioned nucleosomes. B. Aggregate MNase midpoint and DNase I cutsite depths across all regions and for the subset of regions with LLR>500.
Figure 5
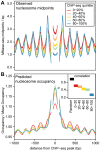
Figure 5. Predicted and observed nucleosome occupancy around ChIP–seq peaks.
A. Mean MNase midpoint depth around ChIP-seq peak summits, aggregated across 5 transcription factors (CTCF, NF-kB, Irf4, C-fos and GABP). Regions are aligned such that the estimated locations of the +1 nucleosome, the −1 nucleosome and the midpoint between the nucleosomes are at the same position. Segments that have data from less than 50% of the ChIP-seq peaks (because of the variable spacing between nucleosomes) are omitted. Regions are stratified into ChIP-seq read depth quintiles, (higher quintiles indicate higher transcription factor occupancy). B. Predicted nucleosome occupancy from an in vitro sequence model . Each region is normalized by the mean predicted occupancy of the entire region. As in A, regions are aligned on putative nucleosome positions and are stratified into ChIP-seq read depth quintiles and segments with data from less than 50% of the ChIP-seq peaks are omitted. The inset shows Spearman's rank correlation (ρ) between predicted and observed nucleosome occupancy for these regions and for 1000 randomly sampled genomic regions.
Figure 6
Figure 6. Nucleosome organization in regions with an association between DNase I sensitivity and genotype (dsQTLs).
Data are aggregated across dsQTLs and are scaled by the total number of sequenced reads. The DNase-seq data are from 70 individuals and the MNase-seq data are from 7 individuals. This plot was created using a subset of dsQTLs (n = 1101) that have a narrow region of DNase I sensitivity (below the median) and a large difference in sensitivity between genotypes (above the median). The complete set of filtered dsQTLs shows the same trend (Figure S16). A. The density of DNase I nicks for different dsQTL genotypes. B. The density of MNase midpoints for different dsQTL genotypes.

Similar articles

Cited by

References

    1. Kornberg RD (1974) Chromatin structure: a repeating unit of histones and DNA. Science 184: 868–871. - PubMed
    1. Kornberg RD, Lorch Y (1999) Twenty-five years of the nucleosome, fundamental particle of the eukaryote chromosome. Cell 98: 285–294. - PubMed
    1. John S, Sabo PJ, Thurman RE, Sung MH, Biddie SC, et al. (2011) Chromatin accessibility pre-determines glucocorticoid receptor binding patterns. Nat Genet 43: 264–8. - PMC - PubMed
    1. Kaplan T, Li XY, Sabo PJ, Thomas S, Stamatoyannopoulos JA, et al. (2011) Quantitative Models of the Mechanisms That Control Genome-Wide Patterns of Transcription Factor Binding during Early Drosophila Development. PLoS Genet 7: e1001290 doi:10.1371/journal.pgen.1001290. - DOI - PMC - PubMed
    1. Albert I, Mavrich TN, Tomsho LP, Qi J, Zanton SJ, et al. (2007) Translational and rotational settings of H2A.Z nucleosomes across the Saccharomyces cerevisiae genome. Nature 446: 572–576. - PubMed

Publication types

Associated data