. 2013 Mar;54(3):794-805.
doi: 10.1194/jlr.M033985. Epub 2012 Nov 16.

Sphingomyelin synthase 1 activity is regulated by the BCR-ABL oncogene

Affiliations

Sphingomyelin synthase 1 activity is regulated by the BCR-ABL oncogene

Tara Ann Burns et al. J Lipid Res. 2013 Mar.

Abstract

Sphingomyelin synthase (SMS) produces sphingomyelin while consuming ceramide (a negative regulator of cell proliferation) and forming diacylglycerol (DAG) (a mitogenic factor). Therefore, enhanced SMS activity could favor cell proliferation. To examine if dysregulated SMS contributes to leukemogenesis, we measured SMS activity in several leukemic cell lines and found that it is highly elevated in K562 chronic myelogenous leukemia (CML) cells. The increased SMS in K562 cells was caused by the presence of Bcr-abl, a hallmark of CML; stable expression of Bcr-abl elevated SMS activity in HL-60 cells while inhibition of the tyrosine kinase activity of Bcr-abl with Imatinib mesylate decreased SMS activity in K562 cells. The increased SMS activity was the result of up-regulation of the Sms1 isoform. Inhibition of SMS activity with D609 (a pharmacological SMS inhibitor) or down-regulation of SMS1 expression by siRNA selectively inhibited the proliferation of Bcr-abl-positive cells. The inhibition was associated with an increased production of ceramide and a decreased production of DAG, conditions that antagonize cell proliferation. A similar change in lipid profile was also observed upon pharmacological inhibition of Bcr-abl (K526 cells) and siRNA-mediated down-regulation of BCR-ABL (HL-60/Bcr-abl cells). These findings indicate that Sms1 is a downstream target of Bcr-abl, involved in sustaining cell proliferation of Bcr-abl-positive cells.


Figures
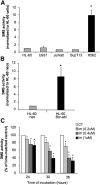
Fig. 1.
Fig. 1.
Expression of Bcr-abl increased SMS activity. A: In vitro SMS activity was measured in a panel of exponentially growing leukemic cell lines as described in the Materials and Methods section. The SMS activity was normalized to that of HL-60 cells. B: In vitro SMS activity was measured in exponentially growing HL-60 cells stably expressing the BCR-ABL oncogene (p185) (HL-60 Bcr-abl) and control cells carrying the empty vector (HL-60 neo) as described in the Materials and Methods section. C: K562 cells (0.1 × 10⁶ cell/ml) were incubated in the presence of the indicated concentrations of imatinib (Im) or vehicle control (CT) for different periods of time. At the reported time points, 3 × 10⁶ cells were collected for SMS activity. Data represent the average and standard deviation of at least three separate experiments. Where standard deviations are not visible, the standard deviation is too small compared with the scale of the y axis. Asterisk indicates significance to HL-60/neo or to control cells (CT) (P < 0.05).
Fig. 2.
Fig. 2.
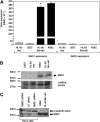
Bcr-abl induced up-regulation of Sms1. A: Expression of BCR-ABL (HL-60/Bcr-abl and K562) caused an approximately 35-fold increase of SMS1 expression compared with Bcr-abl-negative cells (HL-60 neo and U937), whereas it caused a drop of SMS2 expression compared with Bcr-abl-negative cells. Expression of SMS1 and SMS2 were determined by real-time PCR as indicated in the Materials and Methods section and normalized against β-actin. B: Total membrane fractions were collected from exponentially growing cells, and Western blotting analysis using 80 μg of proteins was performed as described in the Materials and Methods section using nonpurified polyclonal antibodies raised against recombinant full-length Sms1 protein (ExAlpha Biologicals). Equal loading was confirmed by Ponceau staining (loading control panel). C: The identity of the Sms1 band was determined based on the specific disappearance of the same molecular weight band in Hela cells after siRNA-mediated SMS1 down-regulation as compared with cells transfected with a scrambled siRNA (CT siRNA) or a siRNA against SMS2 (SMS2 siRNA). These results are representative of two separate experiments. Where error bars are not visible, the error bar is too small compared with the scale of the y axis. Asterisk indicates significance to HL-60/neo (P < 0.05). MNE, mean of normalized expression.
Fig. 3.
Fig. 3.
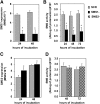
Sms1 is the main contributor to SMS activity in K562 cells. SMS1 (SMS1-) and SMS2 (SMS2-) were down-regulated in K562 cells by treatment with siRNA (40 nM up to 72 h). Treatment with SMS1 siRNA significantly decreased SMS1 expression as measured by real-time PCR (A) without significantly affecting SMS2 expression (C). The siRNA-induced SMS1 decrease caused a decrease of total in vitro SMS activity (B). SMS2 siRNA did not affect in vitro SMS activity (D). These results are representative of at least three separate experiments. AU, arbitrary fluorescence units; MNE, mean of normalized expression. Asterisk indicates significance to SCR control (P < 0.05).
Fig. 4.
Fig. 4.
Effect of inhibition of SMS on ceramide and DAG levels. K562 cells were treated with D609 (50 μg/ml) (A and B) or with control siRNA (SCR) or SMS1 siRNA (SMS1-) (C and D) for 24 h and 48 h. One million cells were collected for each time point and experimental condition and analyzed by mass spectrometry for ceramide (A and C) and DAG (B and D) levels and species by the Lipidomics Core Facility at MUSC. Reported in the graphs are representative ceramide and DAG species. Levels are reported as fold changes versus time-matched control because of the large variation in baseline values. A: C18:0 ceramide [pmoles/nmole Pi], CT 24 h: 0.023 ± 0.013, CT 48 h: 0.015 ± 0.004; C22:1 ceramide (pmoles/nmole Pi): CT 24 h: 0.026 ± 0.016, CT 48 h: 0.02 ± 0.005. B: C14:0/C18:0 DAG (pmoles/nmole Pi): CT 24 h: 0.14 ± 0.1, CT 48 h: 0.36 ± 0.06; C16:0/C18:0 DAG (pmoles/nmole Pi): CT 24 h: 2.57 ± 1.62, CT 48 h: 4.16 ± 0.47. C: C18:0 ceramide (pmoles/nmole Pi), CT 24 h: 0.11 ± 0.05, CT 48 h: 0.13 ± 0.01; C22:1 ceramide (pmoles/nmole Pi): CT 24 h: 0.037 ± 0.009, CT 48 h: 0.07 ± 0.003. D: C14:0/C18:0 DAG (pmoles/nmole Pi): CT 24 h: 0.54 ± 0.22, CT 48 h: 0.084 ± 0.033; C16:0/C18:0 DAG (pmoles/nmole Pi): CT 24 h: 8.91 ± 3.43, CT 48 h: 2.27 ± 0.71. Where standard deviations are not visible, the standard deviation is too small compared with the scale of the y axis. CT, vehicle control. Asterisk indicates significance to time-matched control (P < 0.05).
Fig. 5.
Fig. 5.
Effect of overexpression of Bcr-abl in HL-60 cells on the lipids regulated by Sms1. Two million HL-60/Bcr-abl or HL-60/neo cells of similar passage were allowed to reach the logarithmic phase of growth and were harvested at the same time for lipid analysis. The levels and species of DAG (A) and SM (B) were analyzed from two independent experiments by mass spectrometry at the Lipidomics Core Facility at MUSC. Reported in the graphs are representative DAG and SM species. Levels are reported as fold change versus time-matched control (HL-60/neo) because of the large variation in baseline values. A: C14:0/C18:0 DAG (pmoles/nmole Pi): HL-60/neo: 2.22 ± 1.08; HL-60/Bcr-abl: 23.32 ± 7.01; C16:0/C18:0 DAG (pmoles/nmole Pi): HL-60/neo: 0.96 ± 0.31, HL-60/Bcr-abl: 7.61 ± 2.01. B: C18:0 SM (pmoles/nmole Pi): HL-60/neo: 1.27 ± 0.21; HL-60/Bcr-abl: 4.99 ± 0.18; C22:1 SM (pmoles/nmole Pi): HL-60/neo: 0.98 ± 0.14, HL-60/Bcr-abl: 3.55 ± 0.14. Asterisk indicates significant difference (P < 0.05) of HL-60/Bcr-abl versus control cells (HL-60/neo) once the fold of time-matched control was calculated.
Fig. 6.
Fig. 6.
Inhibition of Bcr-abl induced accumulation of ceramide and reduction of DAG levels. A and B: HL-60/Bcr-abl cells were treated with scrambled siRNA control (SCR) or BCR-ABL siRNA (Bcr-abl-) for 36 h. Two million cells were collected from each experimental condition, and the levels and species of ceramide (A) and DAG (B) were analyzed from three independent experiments. C and D: K562 cells were treated with imatinib (Im, 0.4 or 1 μM) for 24 h and 30 h, and the levels of different species of ceramide (C) and DAG (D) were measured by mass spectrometry. Levels are reported as fold changes versus time-matched control (SCR or CT) because of the large variation in baseline values. A: C18:0 ceramide (pmoles/nmole Pi), SCR: 0.069 ± 0.009; C22:1 ceramide (pmoles/nmole Pi): SCR: 0.11 ± 0.004. B: C14:0/C18:0 DAG (pmoles/nmole Pi): SCR: 0.526 ± 0.027; C16:0/C18:0 DAG (pmoles/nmole Pi): SCR: 7.04 ± 0.24. C: C18:0 ceramide (pmoles/nmole Pi), CT 24 h: 0.043 ± 0.006, CT 30 h: 0.031 ± 0.001; C22:1 ceramide (pmoles/nmole Pi): CT 24 h: 0.083 ± 0.030, CT 30 h: 0.092 ± 0.017. D: C14:0/C18:0 DAG (pmoles/nmole Pi): CT 24 h: 0.28 ± 0.067, CT 30 h: 0.60 ± 0.073; C16:0/C18:0 DAG (pmoles/nmole Pi): CT 24 h: 4.87 ± 1.023, CT 30 h: 9.66 ± 1.35. Where standard deviations are not visible, the standard deviation is too small compared with the scale of the y axis. Asterisk indicates significant difference between HL-60/Bcr-abl(-) and SCR control or imatinib-treated and control cells (P < 0.05). CT, control; Im, imatinib-treated cells. Reported in the graphs are representative ceramide and DAG species.
Fig. 7.
Fig. 7.
Inhibition of SMS activity in K562 cells significantly reduced cell proliferation. Changes in proliferation after pharmacological (A) or siRNA-mediated inhibition of Sms1 (B) were measured by 3H-thymidine incorporation after 24, 48, and 72 h. A: 3H-Thymidine incorporation was determined after inhibition of total SMS with D609 (50 μg/ml). B: Cells were transduced with lentivirus containing control particles (shRNA-NTCP) or viral particles containing sequences to induce partial stable down-regulation of SMS1 (shRNA-SMS1). 3H-thymidine incorporation was then measured in shRNA-NTCP transiently transfected with Allstar scrambled siRNA control (shRNA-NTCP/SCR) and shRNA-SMS1 cells transiently transfected with SMS1 siRNA. Results represent the average and standard deviation of a minimum of four separate experiments. Where standard deviations are not visible, the standard deviation is too small compared with the scale of the y axis. Asterisk indicates significant difference versus control or shRNA-NTCP/SCR (P < 0.05). CPMs, counts per minute; NTCP, nontransducing control particles; ShRNA, short-hairpin RNA.

Similar articles

Cited by

References

    1. Bernert J. T., Ullman M. D. 1981. Biosynthesis of sphingomyelin from erythro-ceramides and phosphatidylcholine by a microsomal cholinephosphoesterase. Biochim. Biophys. Acta. 666: 99–109 - PubMed
    1. Hatch G. M., Vance D. E. 1992. Stimulation of sphingomyelin biosynthesis by brefeldin A and sphingomyelin breakdown by okadaic acid treatment of rat hepatocytes. J. Biol. Chem. 267: 12443–12451 - PubMed
    1. Marggraf W. D., Anderer F. A., Kanfer J. 1981. The formation of sphingomyelin from phosphatidylcholine in plasma membrane preparations from mouse fibroblasts. Biochim. Biophys. Acta. 664: 61–73 - PubMed
    1. Marggraf W. D., Zertani R., Anderer F. A., Kanfer J. N. 1982. The role of endogenous phosphatidylcholine and ceramide in the biosynthesis of sphingomyelin in mouse fibroblasts. Biochim. Biophys. Acta. 710: 314–323 - PubMed
    1. Merrill A. H., Jr, Jones D. D. 1990. An update of the enzymology and regulation of sphingomyelin metabolism. Biochim.Biophys.Acta Lipids Lipid Metab. 1044: 1–12 - PubMed

Publication types

MeSH terms

LinkOut - more resources