

Silencing of proviruses in embryonic cells: efficiency, stability and chromatin modifications
- PMID: 23154467
- PMCID: PMC3537137
- DOI: 10.1038/embor.2012.182
Silencing of proviruses in embryonic cells: efficiency, stability and chromatin modifications
Abstract
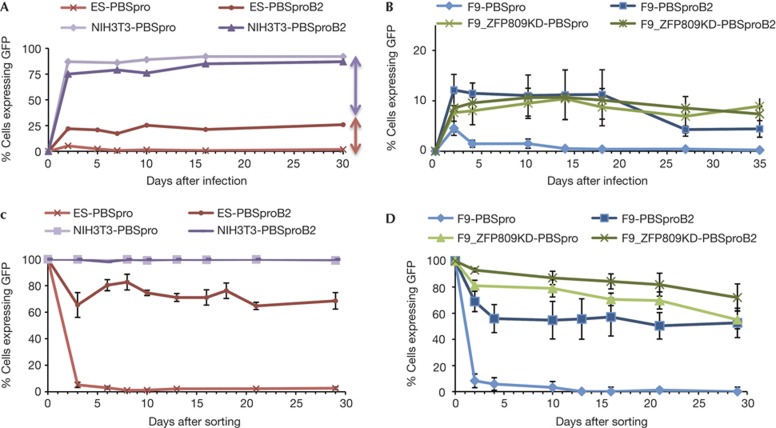
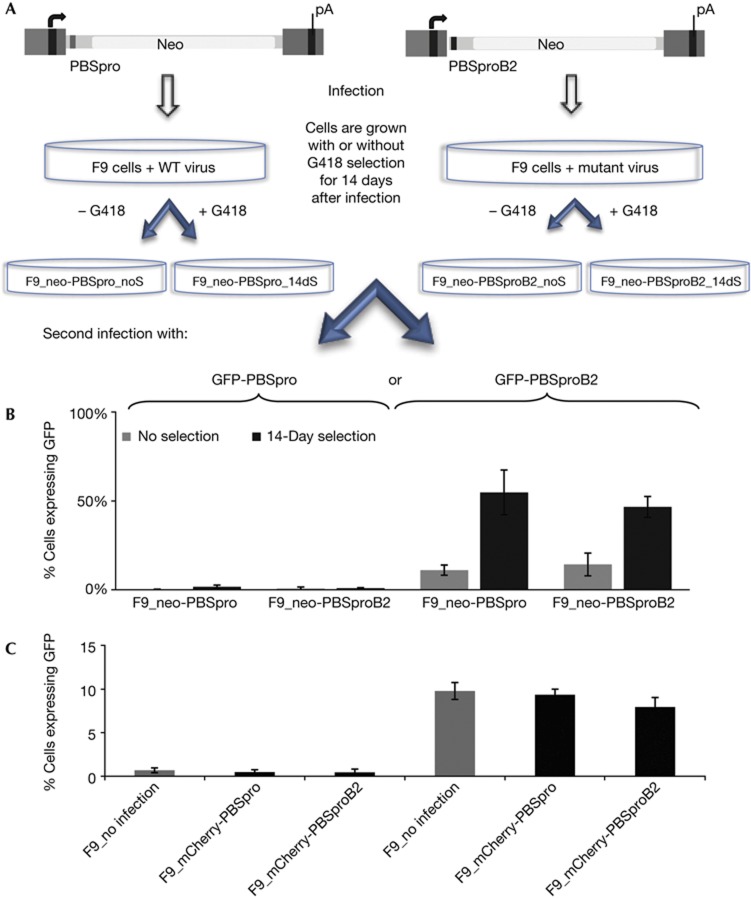
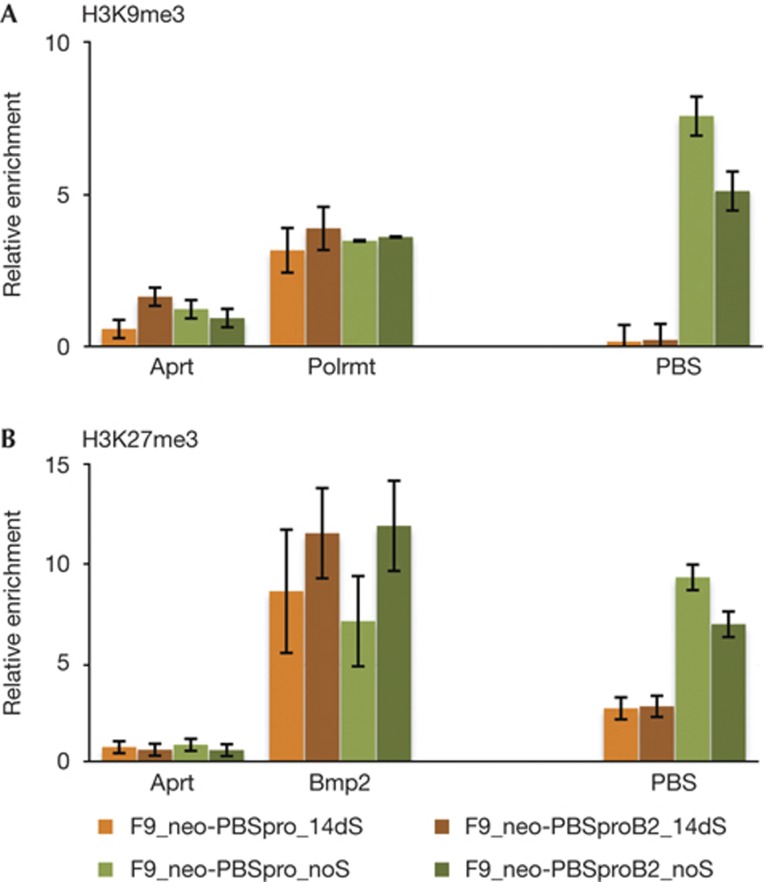
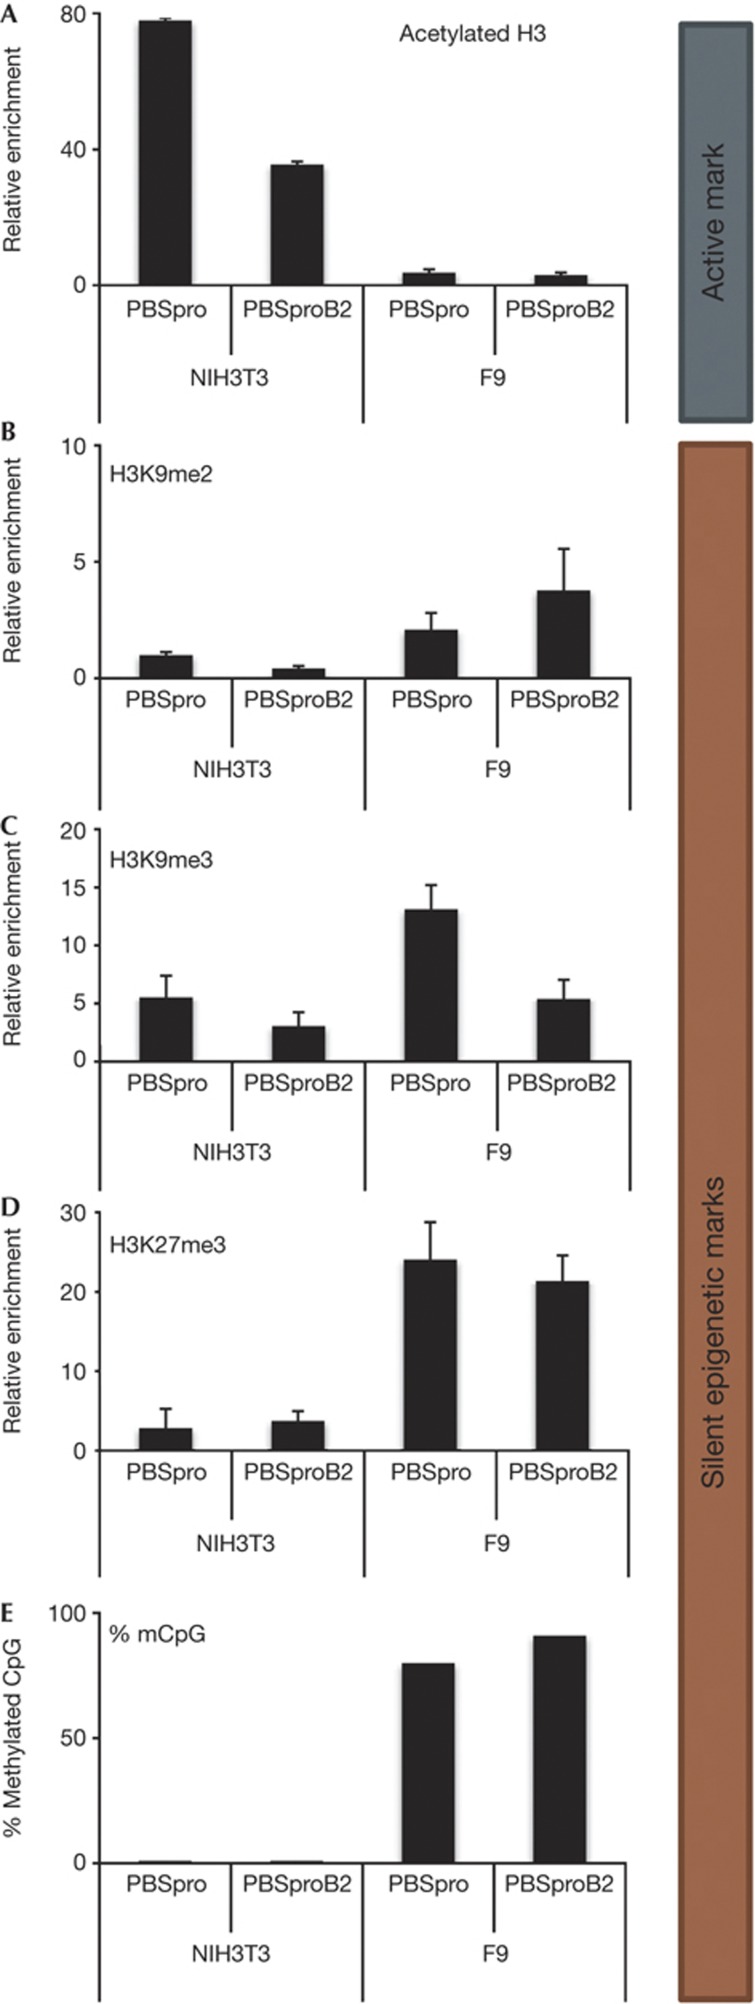
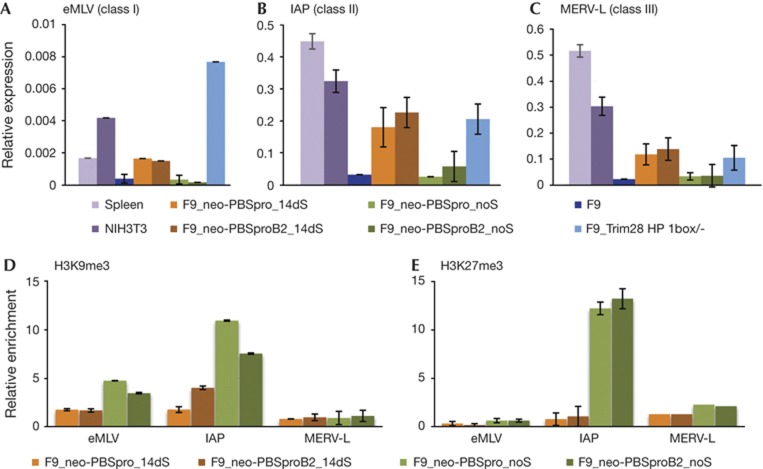
Embryonic stem cells repress retroviral infection through transcriptional silencing of proviral DNAs. We characterized two distinct mechanisms of silencing in embryonic mouse cells infected by Moloney murine leukaemia virus (MLV): a highly efficient one targeting the proline transfer RNA primer-binding site (PBSpro), and a less efficient one operating independently of the PBS. Rare virus-expressing populations were isolated, and the timing and efficiency of establishment of silencing were determined. Superinfection of the selected virus-expressing cells with a second virus carrying a distinguishable reporter revealed that the PBSpro-directed silencing was still largely intact, whereas the PBS-independent silencing was partially reduced. The timing and stability of silencing, and the associated chromatin modifications on newly established and endogenous proviruses were determined. The results indicate that epigenetic mechanisms with different specificity and efficiency are used to silence the exogenous retroviral sequences in embryonic cells.
Conflict of interest statement
The authors declare that they have no conflict of interest.
Figures
Similar articles
-
Proviral silencing in embryonic cells is regulated by Yin Yang 1.Cell Rep. 2013 Jul 11;4(1):50-8. doi: 10.1016/j.celrep.2013.06.003. Epub 2013 Jun 27. Cell Rep. 2013. PMID: 23810560 Free PMC article.
-
Transcriptional Silencing of Moloney Murine Leukemia Virus in Human Embryonic Carcinoma Cells.J Virol. 2016 Dec 16;91(1):e02075-16. doi: 10.1128/JVI.02075-16. Print 2017 Jan 1. J Virol. 2016. PMID: 27795446 Free PMC article.
-
Asynchronous transcriptional silencing of individual retroviral genomes in embryonic cells.Retrovirology. 2014 Apr 17;11:31. doi: 10.1186/1742-4690-11-31. Retrovirology. 2014. PMID: 24742368 Free PMC article.
-
Silencing of Unintegrated Retroviral DNAs.Viruses. 2021 Nov 9;13(11):2248. doi: 10.3390/v13112248. Viruses. 2021. PMID: 34835055 Free PMC article. Review.
-
Retroviral transcriptional regulation and embryonic stem cells: war and peace.Mol Cell Biol. 2015 Mar;35(5):770-7. doi: 10.1128/MCB.01293-14. Epub 2014 Dec 29. Mol Cell Biol. 2015. PMID: 25547290 Free PMC article. Review.
Cited by
-
Proviral silencing in embryonic cells is regulated by Yin Yang 1.Cell Rep. 2013 Jul 11;4(1):50-8. doi: 10.1016/j.celrep.2013.06.003. Epub 2013 Jun 27. Cell Rep. 2013. PMID: 23810560 Free PMC article.
-
Systematic identification of factors for provirus silencing in embryonic stem cells.Cell. 2015 Sep 24;163(1):230-45. doi: 10.1016/j.cell.2015.08.037. Epub 2015 Sep 10. Cell. 2015. PMID: 26365490 Free PMC article.
-
The role of Smarcad1 in retroviral repression in mouse embryonic stem cells.Mob DNA. 2024 Mar 11;15(1):4. doi: 10.1186/s13100-024-00314-z. Mob DNA. 2024. PMID: 38468276 Free PMC article.
-
Transposable elements at the center of the crossroads between embryogenesis, embryonic stem cells, reprogramming, and long non-coding RNAs.Sci Bull (Beijing). 2015;60(20):1722-1733. doi: 10.1007/s11434-015-0905-x. Epub 2015 Oct 13. Sci Bull (Beijing). 2015. PMID: 26543668 Free PMC article. Review.
-
Inhibition of human endogenous retrovirus-K by antiretroviral drugs.Retrovirology. 2017 Mar 22;14(1):21. doi: 10.1186/s12977-017-0347-4. Retrovirology. 2017. PMID: 28330477 Free PMC article.
References
-
- Teich NM, Weiss RA, Martin GR, Lowy DR (1977) Virus infection of murine teratocarcinoma stem cell lines. Cell 12: 973–982 - PubMed
-
- Barklis E, Mulligan RC, Jaenisch R (1986) Chromosomal position or virus mutation permits retrovirus expression in embryonal carcinoma cells. Cell 47: 391–399 - PubMed
-
- Ellis J (2005) Silencing and variegation of gammaretrovirus and lentivirus vectors. Hum Gene Ther 16: 1241–1246 - PubMed
-
- Harada F, Peters GG, Dahlberg JE (1979) The primer tRNA for Moloney murine leukemia virus DNA synthesis. Nucleotide sequence and aminoacylation of tRNAPro. J Biol Chem 254: 10979–10985 - PubMed
Publication types
MeSH terms
Substances
Grants and funding
LinkOut - more resources
Full Text Sources
Research Materials
