. 2013 Jan;20(1):46-56.
doi: 10.1038/cgt.2012.83. Epub 2012 Nov 16.

Blockade of inhibitors of apoptosis (IAPs) in combination with tumor-targeted delivery of tumor necrosis factor-α leads to synergistic antitumor activity

Affiliations
Free PMC article

Blockade of inhibitors of apoptosis (IAPs) in combination with tumor-targeted delivery of tumor necrosis factor-α leads to synergistic antitumor activity

Z Yuan et al. Cancer Gene Ther. 2013 Jan.
Free PMC article

Abstract

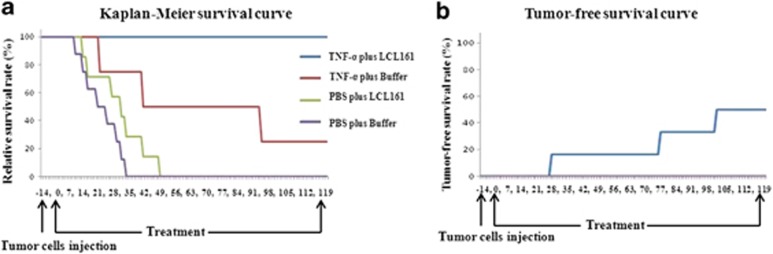
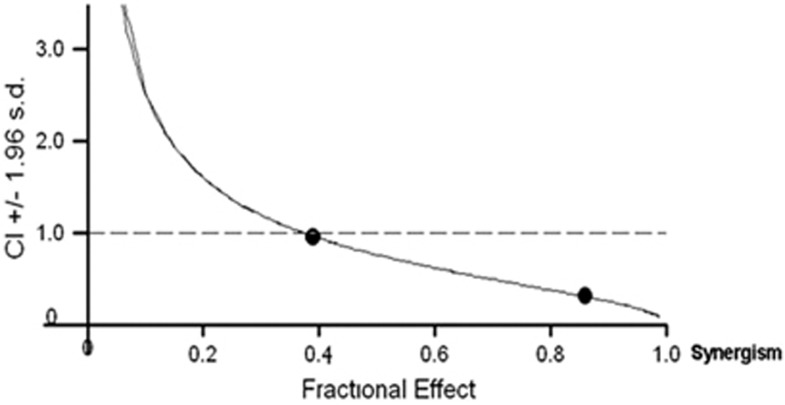
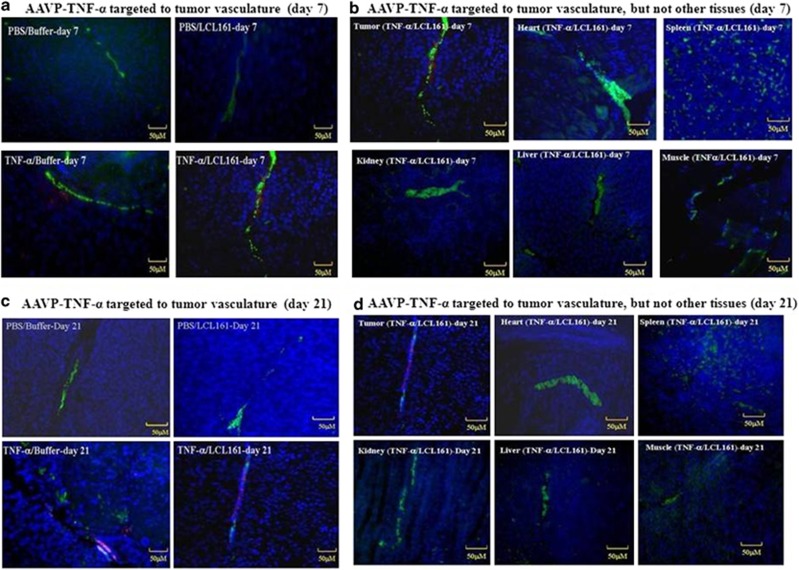
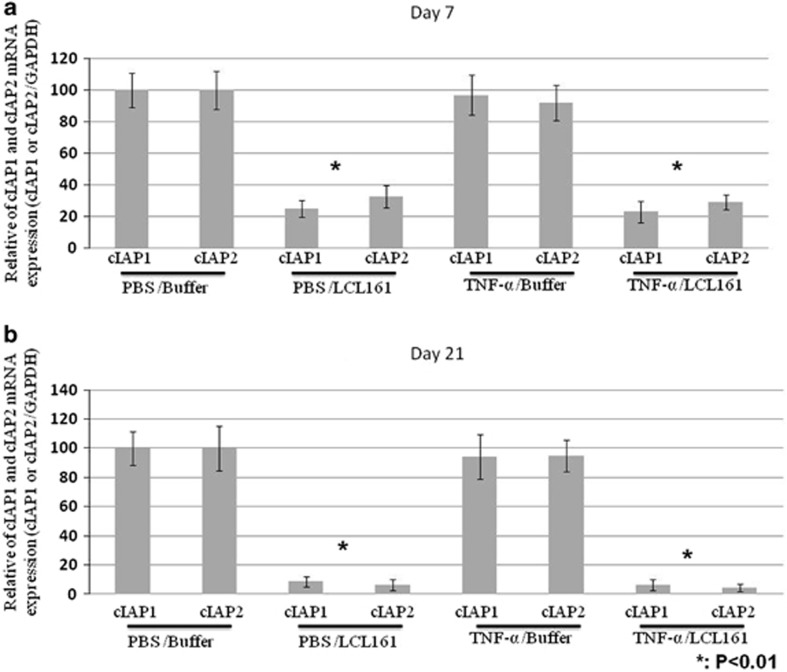
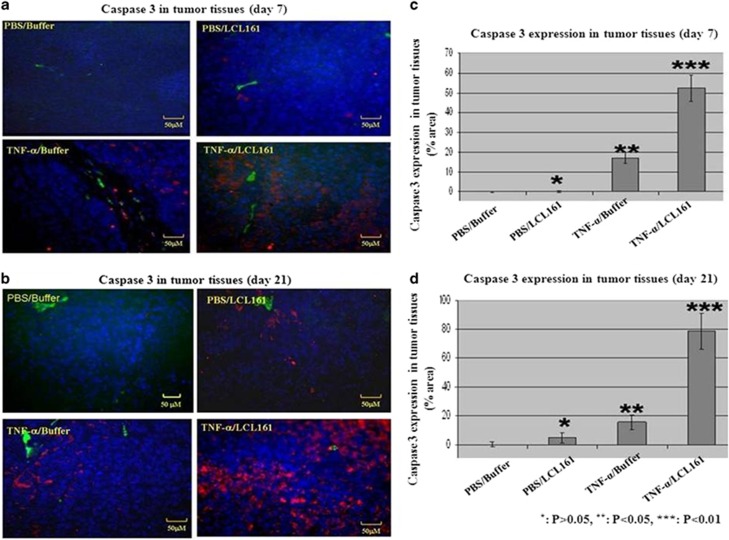
In the current study, we examined whether the combination of tumor vasculature-targeted gene therapy with adeno-associated virus bacteriophage-tumor necrosis factor-α (AAVP-TNF-α) and/or the orally administered LCL161, an antagonist of inhibitors of apoptosis proteins (IAPs), enhanced antitumor efficacy without systemic toxicity. M21 human melanoma xenografts were grown subcutaneously in nude mice. Mice were treated according to one of four treatment regimens: AAVP-TNF-α alone (AAVP-TNF-α plus sodium acetate-acetic acid (NaAc) buffer) via tail vein injection; LCL161 alone (phosphate-buffered saline (PBS) plus LCL161) via oral gavage; AAVP-TNF-α plus LCL161; and PBS plus NaAc Buffer as a control group. Tumor volume, survival and toxicity were analyzed. AAVP trafficking and TNF-α production in vivo were detected on days 7 and 21 by real-time PCR, enzyme-linked immunosorbent assay and immunofluorescence. The levels of apoptosis and activation of caspases were assessed on days 7 and 21 by TUNEL (terminal deoxynucleotidyltransferase-mediated dUTP nick end labeling) and immunofluorescence assays. Our results showed that the combination of AAVP-TNF-α and LCL161 significantly inhibited tumor growth and prolonged survival in mice with melanoma xenografts. The combination of AAVP-TNF-α and LCL161 was also significantly more effective than either agent alone, showing a synergistic effect without systemic toxicity.


Figures

Figure 1
Figure 1
Inhibition of M21 human melanoma xenografts in nude mice treated with targeted adeno-associated virus bacteriophage-tumor necrosis factor-α (AAVP-TNF-α) and/or LCL161. Tumor growth inhibition in all four groups with AAVP-TNF-α plus LCL161; AAVP-TNF-α plus sodium acetate-acetic acid (NaAc) Buffer; phosphate-buffered saline (PBS) plus LCL161; and PBS plus NaAC Buffer treatment from days 0 to 90. a: All mice dead in the control group; b: all mice dead in the PBS plus LCL161 group.
Figure 2
Figure 2
Survival time of mice treated with adeno-associated virus bacteriophage-tumor necrosis factor-α (AAVP-TNF-α) and LCL161. (a) Kaplan–Meier survival curve. The mice were treated with AAVP-TNF-α plus LCL161; AAVP-TNF-α plus sodium acetate-acetic acid (NaAc) Buffer; phosphate-buffered saline (PBS) plus LCL161; and PBS plus NaAc Buffer and monitored over time for their survival. (b) Tumor-free survival curve for treatment with AAVP-TNF-α plus LCL161 (blue), AAVP-TNF-α plus NaAc Buffer (red), PBS plus LCL161 (green) and PBS plus NaAc Buffer (purple). Each day represents the number of mice that were tumor free at the indicated time point.
Figure 3
Figure 3
Synergistic effect of adeno-associated virus bacteriophage-tumor necrosis factor-α (AAVP-TNF-α) and LCL161 in M21 xenograft nude mice. The curve shows the Fraction Effect–Combination Indices plot for the combination of AAVP-TNF-α and LCL161 with the CalcuSyn Software. These results indicated that AAVP-TNF-α and LCL161 were synergistic with CI values <1. Fractional effect: % CK (tumor cell killing)=(Volume Control−Volume Treat)/Volume Control; CI, combination index; CI <1: synergism is indicated.
Figure 4
Figure 4
RGD-AAVP-TNF-α targeted specifically to tumor vasculature after systemic administration. Tumor and normal tissues (heart, spleen, kidney, liver and muscle) from all groups were analyzed for AAVP particles by immmunofluorescence assay (IF). AAVP particles were stained red with anti-bacteriophage antibody (Alexa Fluor 647), tumor vasculature was stained green with CD31 antibody (Alexa Fluor 488) and nuclei were stained blue with 4,6-diamidino-2-phenylindole (DAPI). Scale bar=50 μℳ. Magnification × 200. The adeno-associated virus bacteriophage-tumor necrosis factor-α (AAVP-TNF-α) selectively targeted tumor-associated vasculature in AAVP-TNF-α-treated groups and was absent in nontargeted AAVP-TNF-α groups by day 7 (a) and day 21 (c) after injection; AAVP-TNF-α only selectively targeted tumor-associated vasculature and was absent from normal tissues (heart, spleen, kidney, liver and muscle) in the AAVP-TNF-α-treated groups on day 7 (b) and day 21 (d) after injection.
Figure 5
Figure 5
RGD-AAVP-TNF-α trafficking resulted in selective expression of human TNF-α mRNA in tumor tissue. Levels of human TNF-α mRNA from tumor and normal tissues (heart, spleen, kidney, liver and muscle) from all groups were analyzed by TaqMan assay. The Y axis represents the relative human TNF-α mRNA levels after normalization to glyceraldehyde-3-phosphate dehydrogenase (GAPDH) mRNA. All data are shown as mean±s.d. (a1, a2) mRNA levels of human TNF-α in tumor tissues were significantly increased in targeted AAVP-TNF-α-treated groups in comparison with the other groups on days 7 and 21 after injection (P<0.01 or P<0.001, respectively). (b1, b2, c1, c2), mRNA levels of human TNF-α were detected only in tumors and absent in normal tissues from targeted AAVP-TNF-α-treated groups (AAVP-TNF-α alone and AAVP-TNF-α plus LCL161) on day 7 (P<0.0001) (b1, b2) and day 21 after injection (P<0.0001) (c1, c2). H, heart; K, kidney; L, liver; M, muscle; S, spleen; T, tumor.
Figure 6
Figure 6
RGD-AAVP-TNF-α trafficking resulted in selective human TNF-α expression in tumor tissue. The levels of human TNF-α protein from tumor, normal tissues (heart, spleen, kidney, liver and muscle) and peripheral blood of all groups were evaluated by enzyme-linked immunosorbent assay (ELISA). The Y axis represents human TNF-α in 100 μg of lysate or 50 μl of peripheral blood. All data are shown as mean±s.d. (a1, a2) The level of human TNF-α in tumor tissues was significantly increased in targeted AAVP-TNF-α-treated groups compared with other groups on days 7 and 21 after injection (P<0.001). (b1, b2) The expression of human TNF-α was detected only in tumors and absent in normal tissues from targeted AAVP-TNF-α-treated groups (AAVP-TNF-α alone and AAVP-TNF-α plus LCL161) on days 7 and 21 after injection (P<0.0001). (c) Human TNF-α was absent in peripheral blood from all four groups at pretreatment (day 0) and on days 7 and 21 after treatment with targeted AAVP-TNF-α injected systemically.
Figure 7
Figure 7
Apoptosis was induced and enhanced in tumor and tumor vasculature by the combination of adeno-associated virus bacteriophage-tumor necrosis factor-α (AAVP-TNF-α) and LCL161. Apoptotic cell nuclei in tumor tissues from all groups were detected on days 7 and 21 after treatment. Apoptotic cells were stained red by TUNEL (terminal deoxynucleotidyltransferase-mediated dUTP nick end labeling) assay and nuclei were stained blue with 4,6-diamidino-2-phenylinodole (DAPI). Scale bar=20 μℳ and 50 μℳ. The apoptotic index was defined as the average number of apoptotic cells per high power view counted from six sections from three mice at each time point. All data are shown as mean±s.d. The number of apoptotic cells in tumor tissues was increased in treated groups compared with the control group on day 7 (a) and day 21 (b) after treatment. The combination of targeted AAVP-TNF-α plus LCL161 exhibited the greatest number of apoptotic cells compared with either AAVP-TNF-α alone or LCL161 alone (magnification × 200). (c, d) The number of apoptotic cells in the tumor tissues was quantified by apoptotic index. The apoptotic index in tumor tissues was increased significantly in the treatment groups compared with the control group on days 7 and 21 after treatment (P<0.05). The combination of AAVP-TNF-α and LCL161 resulted in the highest apoptotic index in comparison with either AAVP-TNF-α alone or LCL161 alone on days 7 and 21 after treatment (P<0.001). *P<0.05; **P<0.01.
Figure 8
Figure 8
mRNA expression levels of cellular inhibitor of apoptosis 1 and 2 (cIAP1 and cIAP2) were significantly decreased by LCL161 treatment. mRNA levels of cIAP1 and cIAP2 from tumor tissues in all groups were analyzed by real-time reverse-transcriptase-PCR (RT-PCR) assay. The Y axis represents the relative cIAP1 and cIAP2 mRNA levels after normalization to glyceraldehyde-3-phosphate dehydrogenase (GAPDH) mRNA. All data are shown as mean+s.d. mRNA levels of cIAP1 and cIAP2 in tumor tissues were significantly decreased in receiving LCL161-treated groups in comparison without LCL161-treated groups on day 7 (a) and day 21 (b) after injection (*P<0.01).
Figure 9
Figure 9
The combination of adeno-associated virus bacteriophage-tumor necrosis factor-α (AAVP-TNF-α) and LCL161 increases the expression of active caspase 3 in tumor tissues. The active caspase 3 was analyzed in tumor sections from the treatment groups on days 7 and 21 after treatment by immmunofluorescence assay (IF). Active caspase 3 was stained red by an anti-caspase 3 antibody (Alexa Fluor 647), blood vessels were stained green by an anti-CD31 antibody (Alexa Fluor 488) and nuclei were stained blue with 4,6-diamidino-2-phenylinodole (DAPI). Scale bar=50 μℳ. (a) The expression of active caspase 3 in tumor tissues was increased in the treatment groups compared with the control group on day 7 after treatment. The expression of active caspase 3 was the highest in the group receiving the combination of targeted AAVP-TNF-α plus LCL161 in comparison with either AAVP-TNF-α alone or LCL161 alone (magnification × 200). (b) The expression of active caspase 3 in tumor tissues was increased in the treated groups compared with the control group on day 21 after treatment. The combination of AAVP-TNF-α and LCL161 resulted in the highest level of caspase 3, relative to that seen in tissues treated with either AAVP-TNF-α alone or LCL161 alone (magnification × 200). (c, d) The expression of active caspase 3 in tumor tissues was quantified and was increased significantly in the treated groups compared with the control group on day 7 (c) and day 21 (d) after treatment (P< 0.05 or P<0.001, respectively). The levels of active caspase 3 was the highest in the group receiving the combination of targeted AAVP-TNF-α and LCL161 in comparison with groups treated with either AAVP-TNF-α alone or LCL161 alone on day 7 (c) and day 21 (d) after treatment (P<0.001). *P>0.05; **P<0.05; ***P<0.01.
Figure 10
Figure 10
The combination of adeno-associated virus bacteriophage-tumor necrosis factor-α (AAVP-TNF-α) and LCL161 increased the expression of active caspase 9 in tumor tissues. Expression of active caspase 9 was analyzed by immmunofluorescence assay (IF) in tumor sections from the treated and control groups on days 7 and 21 after treatment. Active caspase 9 was stained red by an anti-caspase 9 antibody (Alexa Fluor 647), blood vessels were stained green by an anti-CD31 antibody (Alexa Fluor 488) and nuclei were stained blue with 4,6-diamidino-2-phenylinodole (DAPI). Scale bar=50 μℳ. (a) Levels of active caspase 9 in tumor tissues were increased in treated groups compared with the control on day 7 after treatment. The highest expression of active caspase 9 in tumor tissues was seen in the group receiving combination targeted AAVP-TNF-α plus LCL161 in comparison either AAVP-TNF-α alone or LCL161 alone (magnification × 100). (b) The expression of active caspase 9 in tumor tissues was increased in the treated groups compared with the control group on day 21 after treatment. Similarly, active caspase 9 in tumor tissues was highest in the targeted AAVP-TNF-α plus LCL161-treated group relative to groups treated with either AAVP-TNF-α alone or LCL161 alone (magnification × 100). (c, d) Active caspase 9 in tumor tissues was quantified. Levels were increased significantly in the treated groups compared with the control group on day 7 (c) and day 21 (d) after treatment (P<0.05 or P<0.001, respectively). Active caspase 9 was highest after combined AAVP-TNF-α and LCL161 administration in comparison with that of either AAVP-TNF-α alone or LCL161 alone on day 7 (c) and day 21 (d) after treatment (P<0.001). *P>0.05; **P<0.05; ***P<0.01.

Similar articles

Cited by

References

    1. Larocca D, Kassner PD, Witte A, Ladner RC, Pierce GF, Baird A. Gene transfer to mammalian cells using genetically targeted filamentous bacteriophage. FASEB J. 1999;13:727–734. - PubMed
    1. Barrow PA, Soothill JS. Bacteriophage therapy and prophylaxis: rediscovery and renewed assessment of potential. Trends Microbiol. 1997;5:268–271. - PubMed
    1. Ivanenkov V, Felici F, Menon AG. Uptake and intracellular fate of phage display vectors in mammalian cells. Biochim Biophys Acta. 1999;1448:450–462. - PubMed
    1. Weber-Dabrowska B, Mulczyk M, Gorski A. Bacteriophages as an efficient therapy for antibiotic-resistant septicemia in man. Transplant Proc. 2003;35:1385–1386. - PubMed
    1. Borysowski J, Gorski A. Is phage therapy acceptable in the immunocompromised host. Int J Infect Dis. 2008;12:466–471. - PubMed

Publication types

MeSH terms