. 2012 Nov 15:11:375.
doi: 10.1186/1475-2875-11-375.

Improving N-terminal protein annotation of Plasmodium species based on signal peptide prediction of orthologous proteins

Affiliations

Improving N-terminal protein annotation of Plasmodium species based on signal peptide prediction of orthologous proteins

Armando de Menezes Neto et al. Malar J. .

Abstract

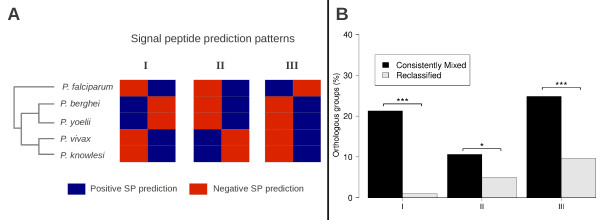
Background: Signal peptide is one of the most important motifs involved in protein trafficking and it ultimately influences protein function. Considering the expected functional conservation among orthologs it was hypothesized that divergence in signal peptides within orthologous groups is mainly due to N-terminal protein sequence misannotation. Thus, discrepancies in signal peptide prediction of orthologous proteins were used to identify misannotated proteins in five Plasmodium species.

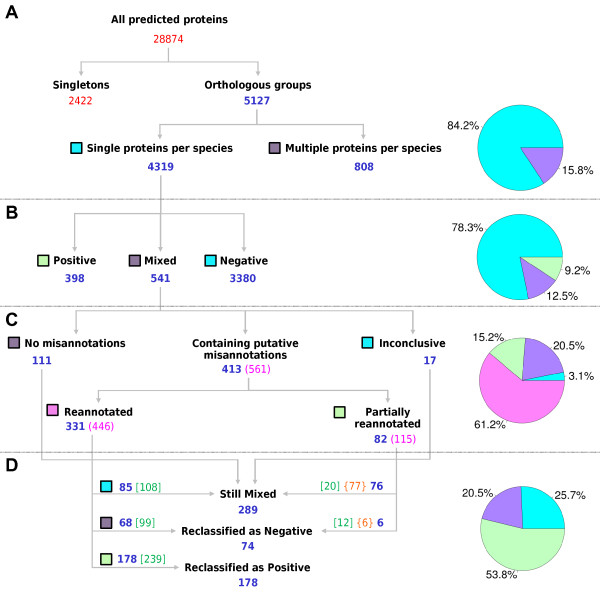
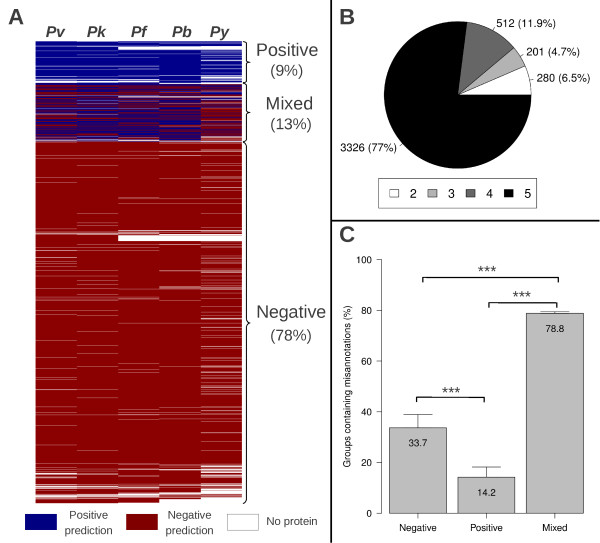
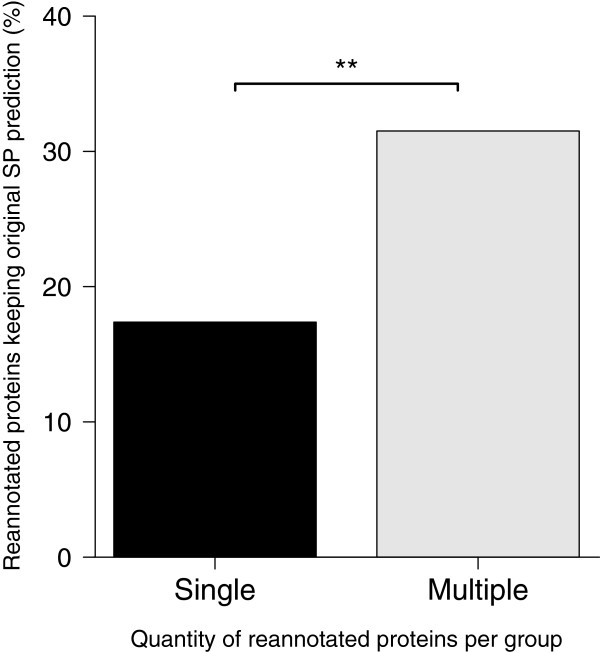
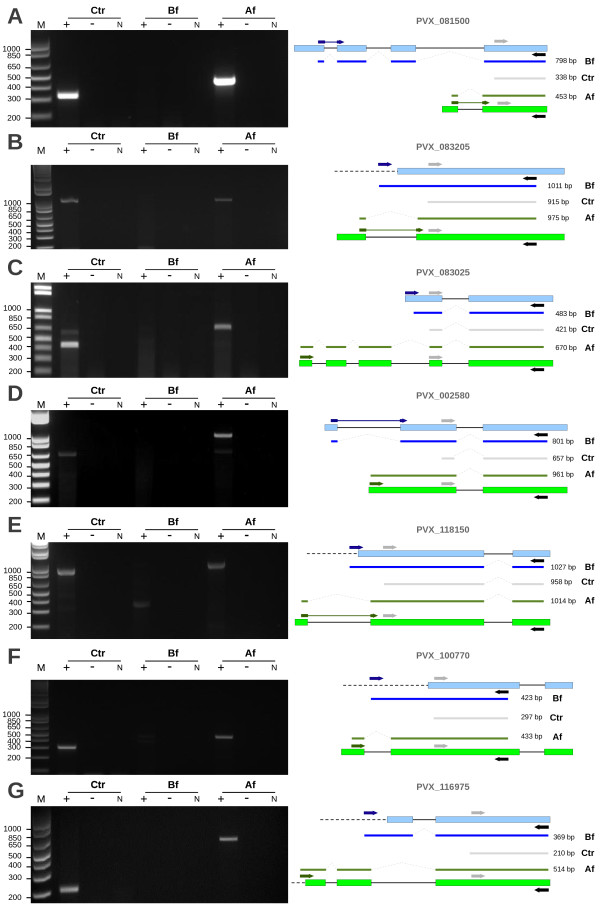
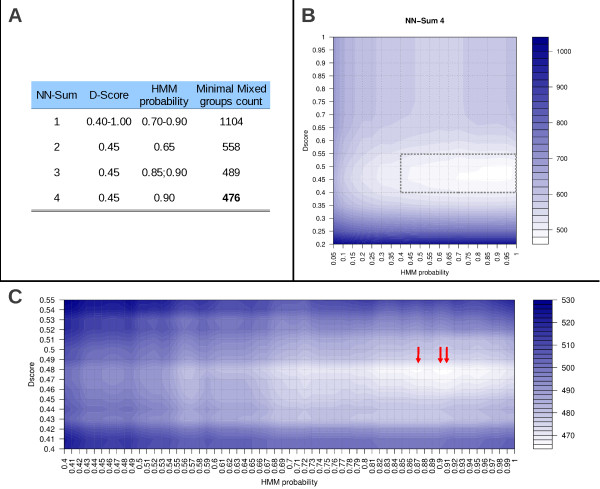
Methods: Signal peptide (SignalP) and orthology (OrthoMCL) were combined in an innovative strategy to identify orthologous groups showing discrepancies in signal peptide prediction among their protein members (Mixed groups). In a comparative analysis, multiple alignments for each of these groups and gene models were visually inspected in search of misannotated proteins and, whenever possible, alternative gene models were proposed. Thresholds for signal peptide prediction parameters were also modified to reduce their impact as a possible source of discrepancy among orthologs. Validation of new gene models was based on RT-PCR (few examples) or on experimental evidence already published (ApiLoc).

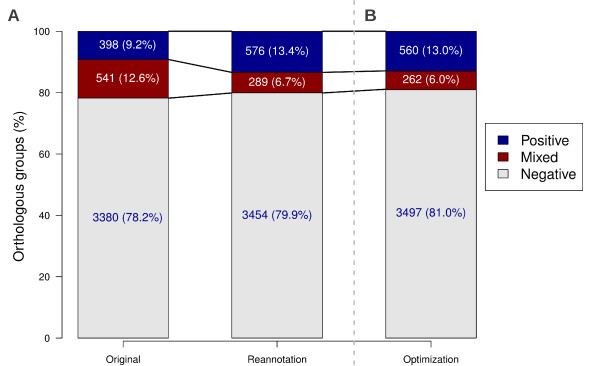
Results: The rate of misannotated proteins was significantly higher in Mixed groups than in Positive or Negative groups, corroborating the proposed hypothesis. A total of 478 proteins were reannotated and change of signal peptide prediction from negative to positive was the most common. Reannotations triggered the conversion of almost 50% of all Mixed groups, which were further reduced by optimization of signal peptide prediction parameters.

Conclusions: The methodological novelty proposed here combining orthology and signal peptide prediction proved to be an effective strategy for the identification of proteins showing wrongly N-terminal annotated sequences, and it might have an important impact in the available data for genome-wide searching of potential vaccine and drug targets and proteins involved in host/parasite interactions, as demonstrated for five Plasmodium species.


Figures

Figure 1
Figure 1
Clustering, selection and classification of orthologous groups. (A) Selection of orthologous groups. Clustering of predicted proteins from five species (P. vivax, P. knowlesi, P. falciparum, P. berghei, P. yoelii) according to orthologs groups defined in OrthoMCL (version 4). Numbers in blue: orthologous groups; in red: total protein numbers. (B) Classification of groups according to signal peptide predictions based on the status of their proteins. The numbers in blue indicate orthologous groups. (C) Categorization of Mixed groups, after visual inspection, into three categories: (i) No misannotations; (ii) Containing putative misannotations; and (iii) Inconclusive. The Containing putative misannotations category was divided into two subcategories: (i) Reannotated; and (ii) Partially reannotated. Numbers in blue: orthologous groups, in pink: numbers of putative misannotated proteins into each category/subcategory. (D) Group reclassification of signal peptide prediction after protein reannotations. Numbers in blue: orthologous groups; in green inside square brackets: reannotated proteins; in orange inside curly brackets: putatively misannotated proteins that could not be revised. To the right, graphs representing the percentages of orthologous groups in each panel, the plotted labels are indicated by square boxes matching the colors in the graphs.
Figure 2
Figure 2
Description of orthologous groups classified based on signal peptide prediction of their proteins. (A) Distribution of 4319 groups from different Plasmodium species: Pv (P. vivax); Pk (P. knowlesi); Pf (P. falciparum); Pb (P. berghei); Py (P. yoelii). Horizontal lines represent each orthologous group. White spaces represent the lack of a protein in the species for that orthologous group. Default PlasmoDB settings were used to consider positive signal peptide predictions: NN-Sum ≥ 3 or D-Score ≥ 0.5 or HMM probability ≥ 0.5. (B) Distribution of number of proteins per orthologous groups, varying from 2 to 5. (C) Proportion of groups showing at least one misannotated protein in each of the three classes: Negative (98/291), Positive (24/169) or Mixed (330/442), error bars= 95% confidence interval. Difference among multiple proportions was measured with the Chi-square test and the Marascuilo post-hoc analysis was used for testing differences between pairs of proportions (*** p<0.0001).
Figure 3
Figure 3
Proportion of reannotated proteins keeping original signal peptide predictions in groups with single or multiple revised proteins. All reannotated proteins were divided in two categories: Single – groups with only one reannotated protein (N=259) and Multiple - groups with at least two reannotated proteins (N=219). The numbers of proteins with unchanged signal peptide prediction in each category were 45 (Single) and 69 (Multiple). The Chi-square test was used to calculate statistical significance of the differences between proportions (** p<0.001)
Figure 4
Figure 4
Protein reannotations and optimization of signal peptide prediction parameters influencing the classes of orthologous groups. (A) Reclassification of groups based on signal peptide prediction due to reannotation of proteins from Mixed groups. Default PlasmoDB settings were used to consider positive signal peptide predictions: NN-Sum ≥ 3 or D-Score ≥ 0.5 or HMM probability ≥ 0.5. (B) Further reclassification of groups due to optimization of signal peptide threshold prediction parameters. The lowest number of Mixed groups was achieved by resetting thresholds to: NN-Sum = 4; D-Score = 0.48 and HMM probability = 0.9.
Figure 5
Figure 5
Experimental validation of proposed new gene models. Left panels show the amplification of Plasmodium vivax cDNA isolated from an infected patient. Right panels show schematic representations of the original gene model (light blue boxes) and the new model (light green boxes). PCRs were done using Control (light grey arrow), Before (dark blue arrow) and After (dark green arrow) forward primers with the same Reverse (black arrow) primer in the presence (+) or absence (-) of reverse transcriptase. The resulting amplicons (Before – blue line; Control – grey line; After – green line), with their respective molecular sizes, are shown in the middle of right panels for genes encoding for proteins (description according to BDA results): [PlasmoDB:PVX_081500] adenyl cyclase associated protein (A), [PlasmoDB:PVX_083205] protein transport protein Sec61 alpha subunit (B), [PlasmoDB:PVX_083025] sporozoite microneme protein (C), [PlasmoDB:PVX_002580] pseudouridine synthetase (D), [PlasmoDB:PVX_118150] glutamine cyclotransferase (E), [PlasmoDB:PVX_100770] conserved hypothetical protein (F) and [PlasmoDB:PVX_116975] conserved hypothetical protein (G). Dashed linear lines in gene models represent the 5' UTR of mRNAs. N – negative PCR control (without DNA); M - Molecular marker (1Kb Plus, Invitrogen). The schematic representations of the gene models were not in scale.
Figure 6
Figure 6
Optimization of signal peptide threshold prediction parameters searching for the lowest number of Mixed groups. Several combinations of the three parameters used for signal peptide prediction in PlasmoDB were tested in search of the optimal setting. (A) The first analysis was all possible values of NN-Sum combining with D-Score and HMM probability ranging from 0.05 to 1.0 (intervals of 0.05). (B) Graphic representation of this combination is showed for the optimal threshold of NN-Sum = 4. The area registering the lower numbers of Mixed groups (dotted rectangle) for a refined search using intervals of 0.01 units (C). The lowest number of Mixed groups (465) was achieved by resetting thresholds to: NN-Sum = 4; D-Score = 0.48 and HMM probability = 0.87; 0.90; 0.9 (indicated by the red arrows).
Figure 7
Figure 7
Signal peptide prediction patterns among Plasmodium species. (A) Three distinct patterns of signal peptide predictions were compared to a schematic phylogenetic tree (based on mitochondrial genes [59]) of five Plasmodium species to represent a likely evolutionary support. Pattern I: P. berguei and P. yoelii; Pattern II: P. vivax and P. knowlesi; Pattern III: P. falciparum. (B) The proportions of these three patterns were compared between groups that were originally Mixed but were reclassified because of either reannotations or optimization of signal peptide prediction parameters (N=301) and groups that have retained their classification as Mixed group despite inspections, reannotations and optimization (N=141). The Chi-square test was used to calculate statistical significance of the differences between proportions (* p<0.05, *** p<0.0001).

Similar articles

Cited by

References

    1. World Health Organization. World Malaria Report. Geneva: WHO Press; 2011.
    1. Guerra CA, Snow RW, Hay SI. Mapping the global extent of malaria in 2005. Trends Parasitol. 2006;22:353–358. doi: 10.1016/j.pt.2006.06.006. - DOI - PMC - PubMed
    1. malERA Consultative Group on Drugs. A research agenda for malaria eradication: drugs. PLoS Med. 2011;8:e1000402. - PMC - PubMed
    1. Raghavendra K, Barik TK, Reddy BP, Sharma P, Dash AP. Malaria vector control: from past to future. Parasitol Res. 2011;108:757–779. doi: 10.1007/s00436-010-2232-0. - DOI - PubMed
    1. World Health Organization. World Malaria Report. Geneva: WHO Press; 2010.

Publication types

MeSH terms

LinkOut - more resources