

Variable evolutionary routes to host establishment across repeated rabies virus host shifts among bats
- PMID: 23150575
- PMCID: PMC3511767
- DOI: 10.1073/pnas.1203456109
Variable evolutionary routes to host establishment across repeated rabies virus host shifts among bats
Abstract
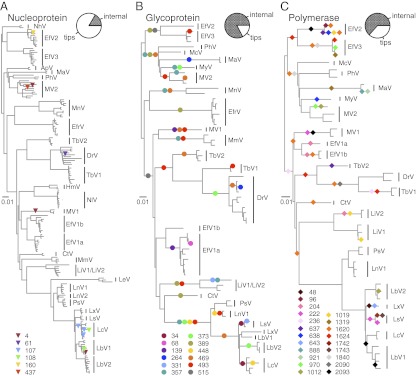
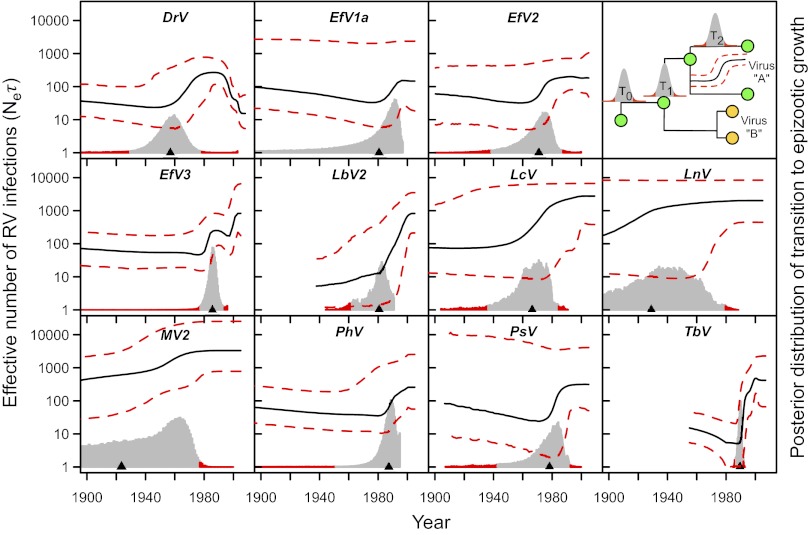
Determining the genetic pathways that viruses traverse to establish in new host species is crucial to predict the outcome of cross-species transmission but poorly understood for most host-virus systems. Using sequences encoding 78% of the rabies virus genome, we explored the extent, repeatability and dynamic outcome of evolution associated with multiple host shifts among New World bats. Episodic bursts of positive selection were detected in several viral proteins, including regions associated with host cell interaction and viral replication. Host shifts involved unique sets of substitutions, and few sites exhibited repeated evolution across adaptation to many bat species, suggesting diverse genetic determinants over host range. Combining these results with genetic reconstructions of the demographic histories of individual viral lineages revealed that although rabies viruses shared consistent three-stage processes of emergence in each new bat species, host shifts involving greater numbers of positively selected substitutions had longer delays between cross-species transmission and enzootic viral establishment. Our results point to multiple evolutionary routes to host establishment in a zoonotic RNA virus that may influence the speed of viral emergence.
Conflict of interest statement
The authors declare no conflict of interest.
Figures
Similar articles
-
Host phylogeny constrains cross-species emergence and establishment of rabies virus in bats.Science. 2010 Aug 6;329(5992):676-9. doi: 10.1126/science.1188836. Science. 2010. PMID: 20689015
-
Rates of viral evolution are linked to host geography in bat rabies.PLoS Pathog. 2012;8(5):e1002720. doi: 10.1371/journal.ppat.1002720. Epub 2012 May 17. PLoS Pathog. 2012. PMID: 22615575 Free PMC article.
-
Unique characteristics of bat rabies viruses in big brown bats (Eptesicus fuscus).Arch Virol. 2013 Apr;158(4):809-20. doi: 10.1007/s00705-012-1551-0. Epub 2012 Dec 4. Arch Virol. 2013. PMID: 23208279
-
The role of viral evolution in rabies host shifts and emergence.Curr Opin Virol. 2014 Oct;8:68-72. doi: 10.1016/j.coviro.2014.07.004. Epub 2014 Jul 26. Curr Opin Virol. 2014. PMID: 25064563 Free PMC article. Review.
-
The lyssavirus host-specificity conundrum-rabies virus-the exception not the rule.Curr Opin Virol. 2018 Feb;28:68-73. doi: 10.1016/j.coviro.2017.11.007. Epub 2017 Nov 25. Curr Opin Virol. 2018. PMID: 29182939 Review.
Cited by
-
Introduction of Viral Hemorrhagic Septicemia Virus into Freshwater Cultured Rainbow Trout Is Followed by Bursts of Adaptive Evolution.J Virol. 2018 May 29;92(12):e00436-18. doi: 10.1128/JVI.00436-18. Print 2018 Jun 15. J Virol. 2018. PMID: 29643236 Free PMC article.
-
Comparison of intra- and inter-host genetic diversity in rabies virus during experimental cross-species transmission.PLoS Pathog. 2019 Jun 20;15(6):e1007799. doi: 10.1371/journal.ppat.1007799. eCollection 2019 Jun. PLoS Pathog. 2019. PMID: 31220188 Free PMC article.
-
The history of rabies in the Western Hemisphere.Antiviral Res. 2017 Oct;146:221-232. doi: 10.1016/j.antiviral.2017.03.013. Epub 2017 Mar 29. Antiviral Res. 2017. PMID: 28365457 Free PMC article.
-
A permanent host shift of rabies virus from Chiroptera to Carnivora associated with recombination.Sci Rep. 2017 Mar 21;7(1):289. doi: 10.1038/s41598-017-00395-2. Sci Rep. 2017. PMID: 28325933 Free PMC article.
-
Host genotype and genetic diversity shape the evolution of a novel bacterial infection.ISME J. 2021 Jul;15(7):2146-2157. doi: 10.1038/s41396-021-00911-3. Epub 2021 Feb 18. ISME J. 2021. PMID: 33603148 Free PMC article.
References
-
- Daszak P, Cunningham AA, Hyatt AD. Emerging infectious diseases of wildlife—threats to biodiversity and human health. Science. 2000;287(5452):443–449. - PubMed
-
- Shapiro B, Rambaut A, Pybus OG, Holmes EC. A phylogenetic method for detecting positive epistasis in gene sequences and its application to RNA virus evolution. Mol Biol Evol. 2006;23(9):1724–1730. - PubMed
-
- Holmes EC. The Evolution and Emergence of RNA Viruses. New York: Oxford Univ Press; 2009.
Publication types
MeSH terms
Associated data
- Actions
- Actions
- Actions
- Actions
- Actions
- Actions
- Actions
- Actions
- Actions
- Actions
- Actions
- Actions
- Actions
- Actions
- Actions
- Actions
- Actions
- Actions
- Actions
- Actions
- Actions
- Actions
- Actions
- Actions
- Actions
- Actions
- Actions
- Actions
- Actions
- Actions
- Actions
- Actions
- Actions
- Actions
- Actions
- Actions
- Actions
- Actions
- Actions
- Actions
- Actions
- Actions
- Actions
- Actions
- Actions
- Actions
- Actions
- Actions
- Actions
- Actions
- Actions
- Actions
- Actions
- Actions
- Actions
- Actions
- Actions
- Actions
- Actions
- Actions
- Actions
- Actions
- Actions
- Actions
- Actions
- Actions
- Actions
- Actions
- Actions
- Actions
- Actions
- Actions
- Actions
LinkOut - more resources
Full Text Sources
