

A critical role for Mnt in Myc-driven T-cell proliferation and oncogenesis
- PMID: 23150551
- PMCID: PMC3511755
- DOI: 10.1073/pnas.1206406109
A critical role for Mnt in Myc-driven T-cell proliferation and oncogenesis
Abstract
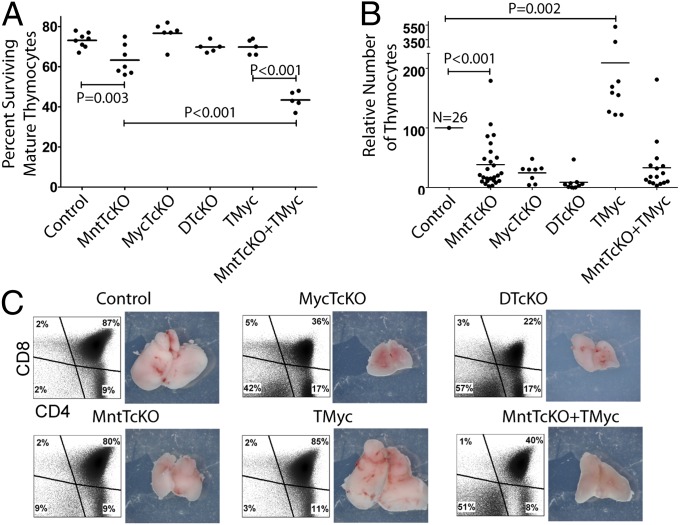
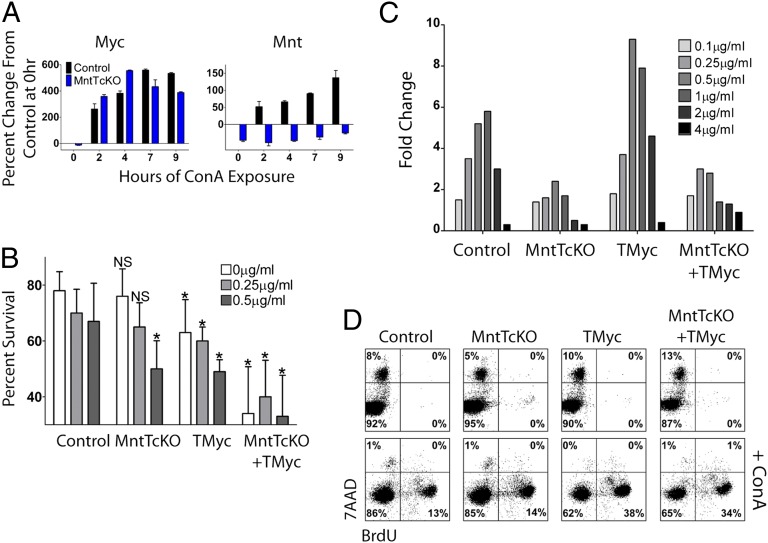
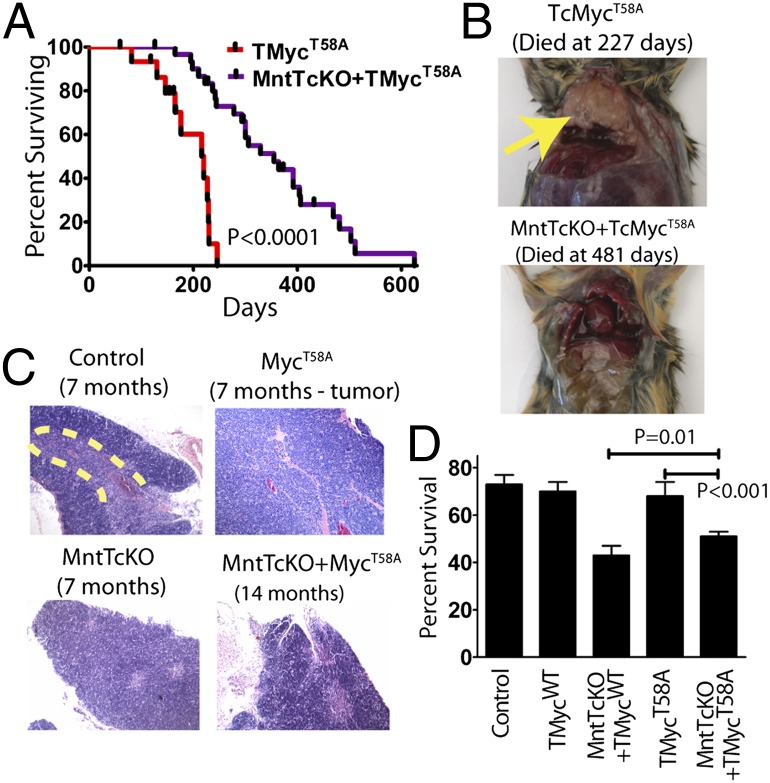
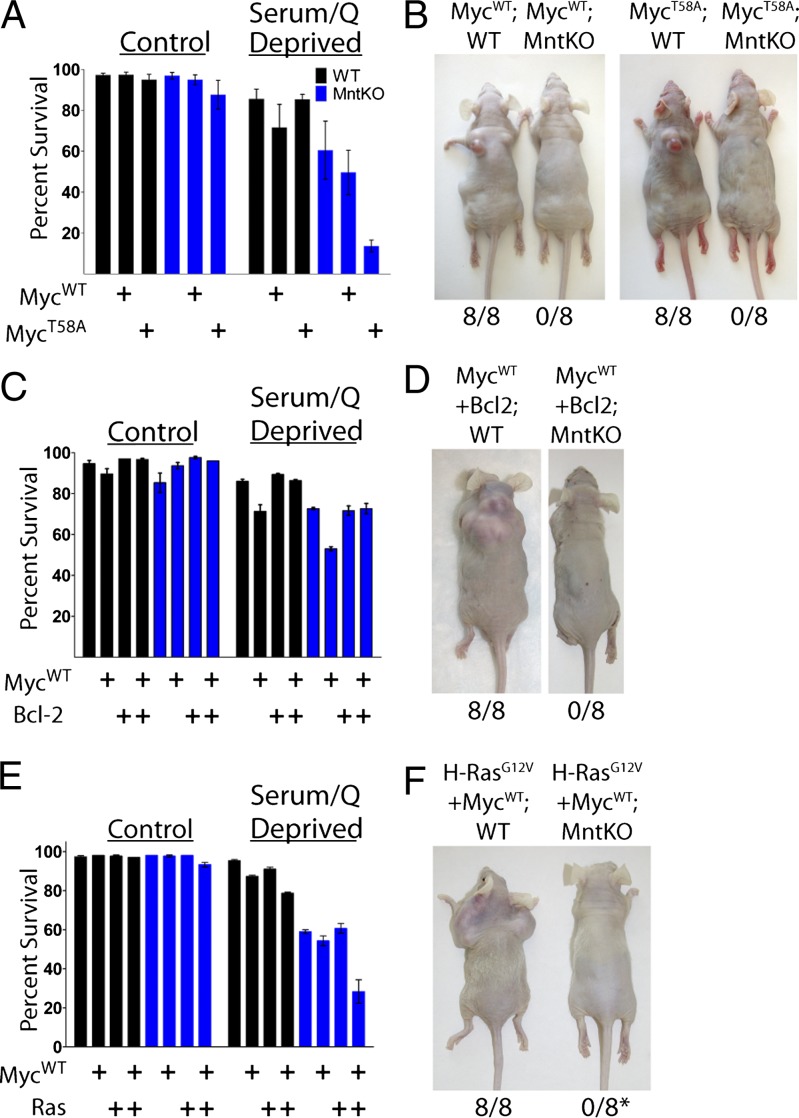
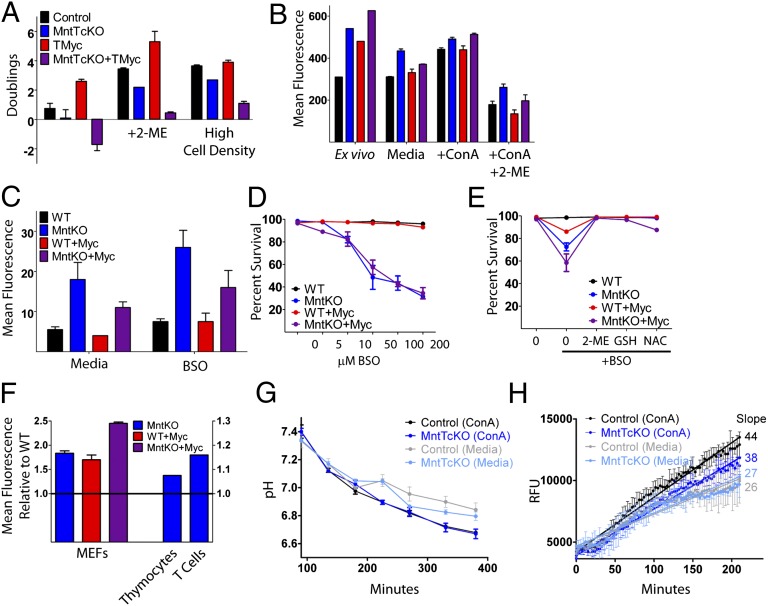
Mnt (Max's next tango) is a Max-interacting transcriptional repressor that can antagonize both the proproliferative and proapoptotic functions of Myc in vitro. To ascertain the physiologically relevant functions of Mnt and to help define the relationship between Mnt and Myc in vivo, we generated a series of mouse strains in which Mnt was deleted in T cells in the absence of endogenous c-Myc or in the presence of ectopic c-Myc. We found that apoptosis caused by loss of Mnt did not require Myc but that ectopic Myc expression dramatically decreased the survival of both Mnt-deficient T cells in vivo and Mnt-deficient MEFs in vitro. Consequently, Myc-driven proliferative expansion of T cells in vitro and thymoma formation in vivo were prevented by the absence of Mnt. Consistent with T-cell models, mouse embryo fibroblasts (MEFs) lacking Mnt were refractory to oncogenic transformation by Myc. Tumor suppression caused by loss of Mnt was linked to increased apoptosis mediated by reactive oxygen species (ROS). Thus, although theoretically and experimentally a Myc antagonist, the dominant physiological role of Mnt appears to be suppression of apoptosis. Our results redefine the physiological relationship between Mnt and Myc and requirements for Myc-driven oncogenesis.
Conflict of interest statement
The authors declare no conflict of interest.
Figures
Similar articles
-
The MNT transcription factor autoregulates its expression and supports proliferation in MYC-associated factor X (MAX)-deficient cells.J Biol Chem. 2020 Feb 14;295(7):2001-2017. doi: 10.1074/jbc.RA119.010389. Epub 2020 Jan 9. J Biol Chem. 2020. PMID: 31919096 Free PMC article.
-
Mnt takes control as key regulator of the myc/max/mxd network.Adv Cancer Res. 2007;97:61-80. doi: 10.1016/S0065-230X(06)97003-1. Adv Cancer Res. 2007. PMID: 17419941 Review.
-
Mnt loss triggers Myc transcription targets, proliferation, apoptosis, and transformation.Mol Cell Biol. 2004 Feb;24(4):1560-9. doi: 10.1128/MCB.24.4.1560-1569.2004. Mol Cell Biol. 2004. PMID: 14749372 Free PMC article.
-
The activities of MYC, MNT and the MAX-interactome in lymphocyte proliferation and oncogenesis.Biochim Biophys Acta. 2015 May;1849(5):554-62. doi: 10.1016/j.bbagrm.2014.04.004. Epub 2014 Apr 13. Biochim Biophys Acta. 2015. PMID: 24731854 Review.
-
Inflammatory disease and lymphomagenesis caused by deletion of the Myc antagonist Mnt in T cells.Mol Cell Biol. 2006 Mar;26(6):2080-92. doi: 10.1128/MCB.26.6.2080-2092.2006. Mol Cell Biol. 2006. PMID: 16507988 Free PMC article.
Cited by
-
Normal and Neoplastic Growth Suppression by the Extended Myc Network.Cells. 2022 Feb 21;11(4):747. doi: 10.3390/cells11040747. Cells. 2022. PMID: 35203395 Free PMC article. Review.
-
T-cell Dysfunction upon Expression of MYC with Altered Phosphorylation at Threonine 58 and Serine 62.Mol Cancer Res. 2022 Jul 6;20(7):1151-1165. doi: 10.1158/1541-7786.MCR-21-0560. Mol Cancer Res. 2022. PMID: 35380701 Free PMC article.
-
MYC needs MNT to drive B cells over the edge.Blood. 2020 Mar 26;135(13):977-978. doi: 10.1182/blood.2019004766. Blood. 2020. PMID: 32219348 Free PMC article.
-
The MYC transcription factor network: balancing metabolism, proliferation and oncogenesis.Front Med. 2018 Aug;12(4):412-425. doi: 10.1007/s11684-018-0650-z. Epub 2018 Jul 27. Front Med. 2018. PMID: 30054853 Free PMC article. Review.
-
The MNT transcription factor autoregulates its expression and supports proliferation in MYC-associated factor X (MAX)-deficient cells.J Biol Chem. 2020 Feb 14;295(7):2001-2017. doi: 10.1074/jbc.RA119.010389. Epub 2020 Jan 9. J Biol Chem. 2020. PMID: 31919096 Free PMC article.
References
-
- Grandori C, Cowley SM, James LP, Eisenman RN. The Myc/Max/Mad network and the transcriptional control of cell behavior. Annu Rev Cell Dev Biol. 2000;16:653–699. - PubMed
-
- Arvanitis C, Felsher DW. Conditional transgenic models define how MYC initiates and maintains tumorigenesis. Semin Cancer Biol. 2006;16(4):313–317. - PubMed
-
- van Riggelen J, Yetil A, Felsher DW. MYC as a regulator of ribosome biogenesis and protein synthesis. Nat Rev Cancer. 2010;10(4):301–309. - PubMed
Publication types
MeSH terms
Substances
Grants and funding
LinkOut - more resources
Full Text Sources
Molecular Biology Databases
