. 2012 Oct 24;32(43):14927-41.
doi: 10.1523/JNEUROSCI.1588-12.2012.

Metalloproteinases and their associated genes contribute to the functional integrity and noise-induced damage in the cochlear sensory epithelium

Affiliations

Metalloproteinases and their associated genes contribute to the functional integrity and noise-induced damage in the cochlear sensory epithelium

Bo Hua Hu et al. J Neurosci. .

Abstract

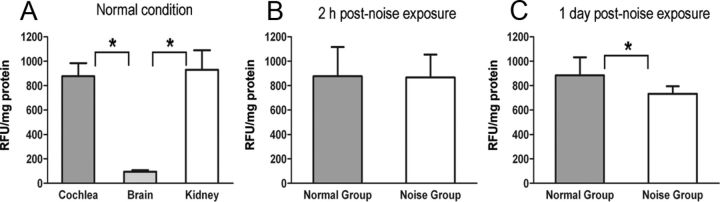
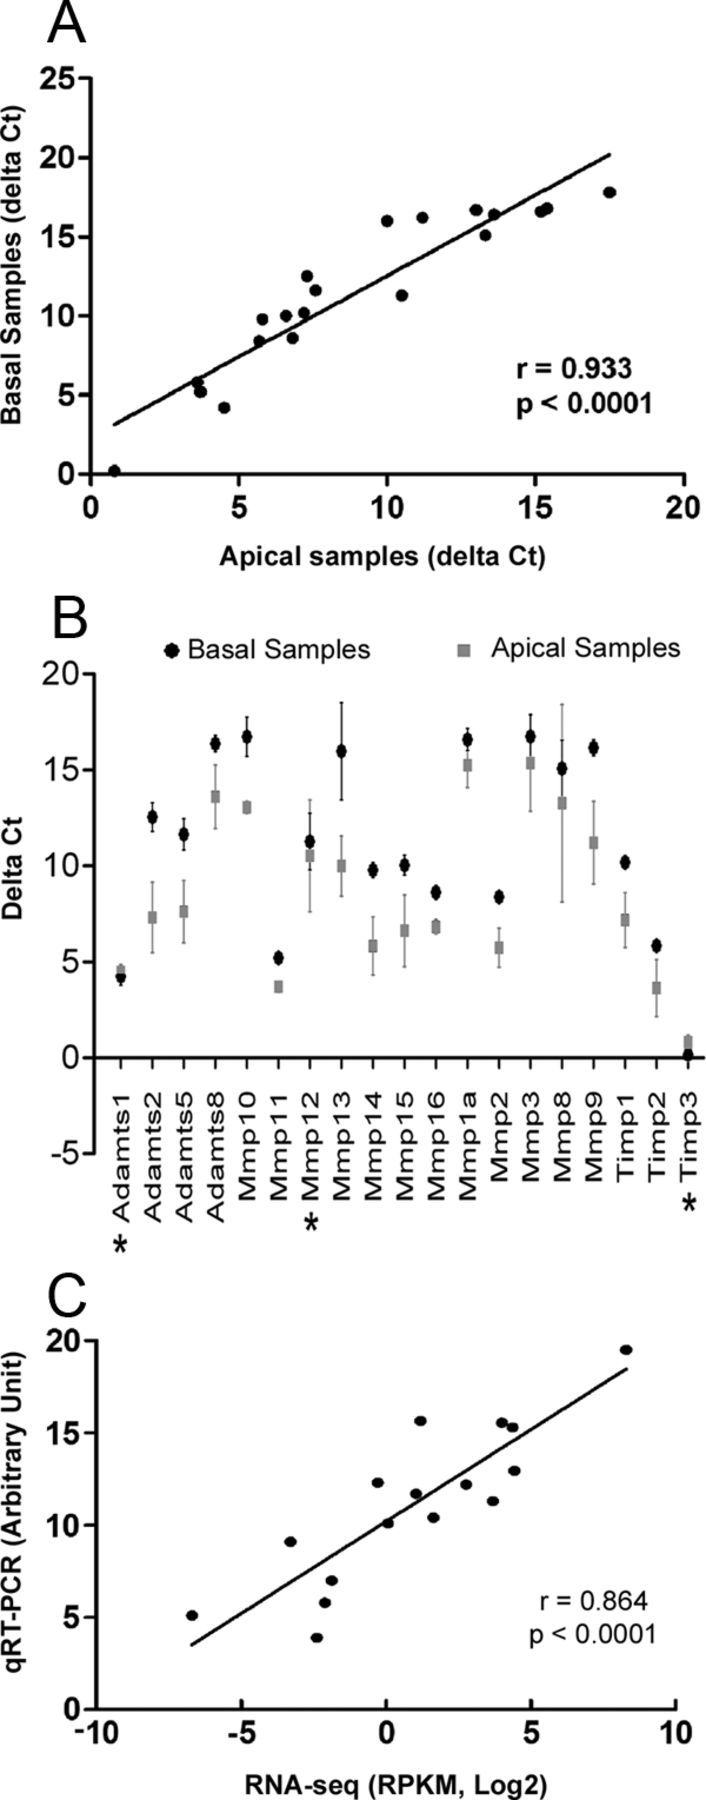
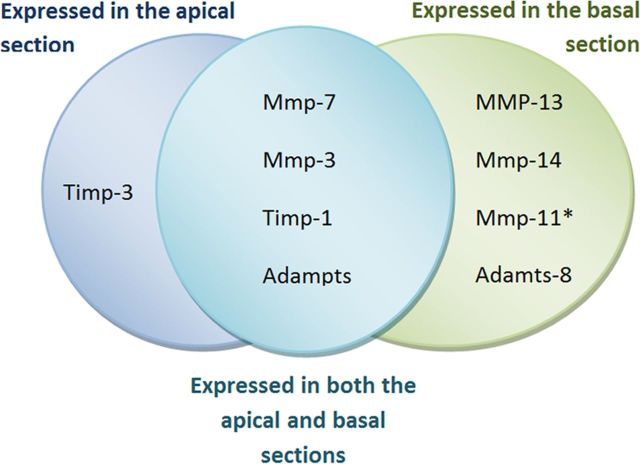
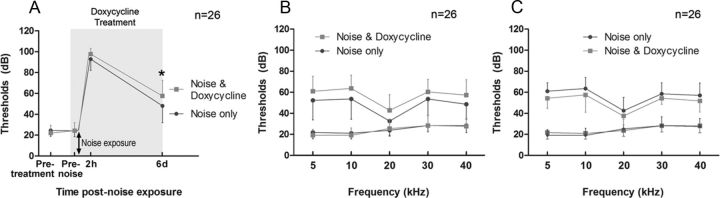
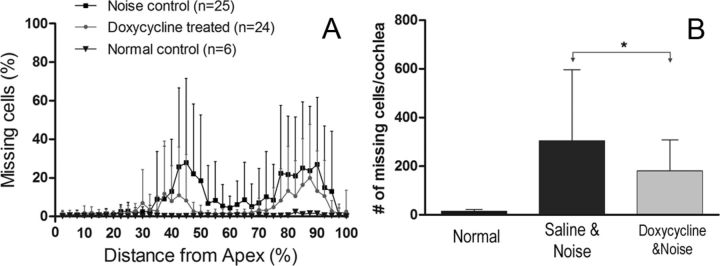
Matrix metalloproteinases (MMPs) and their related gene products regulate essential cellular functions. An imbalance in MMPs has been implicated in various neurological disorders, including traumatic injuries. Here, we report a role for MMPs and their related gene products in the modulation of cochlear responses to acoustic trauma in rats. The normal cochlea was shown to be enriched in MMP enzymatic activity, and this activity was reduced in a time-dependent manner after traumatic noise injury. The analysis of gene expression by RNA sequencing and qRT-PCR revealed the differential expression of MMPs and their related genes between functionally specialized regions of the sensory epithelium. The expression of these genes was dynamically regulated between the acute and chronic phases of noise-induced hearing loss. Moreover, noise-induced expression changes in two endogenous MMP inhibitors, Timp1 and Timp2, in sensory cells were dependent on the stage of nuclear condensation, suggesting a specific role for MMP activity in sensory cell apoptosis. A short-term application of doxycycline, a broad-spectrum inhibitor of MMPs, before noise exposure reduced noise-induced hearing loss and sensory cell death. In contrast, a 7 d treatment compromised hearing sensitivity and potentiated noise-induced hearing loss. This detrimental effect of the long-term inhibition of MMPs on noise-induced hearing loss was further confirmed using targeted Mmp7 knock-out mice. Together, these observations suggest that MMPs and their related genes participate in the regulation of cochlear responses to acoustic overstimulation and that the modulation of MMP activity can serve as a novel therapeutic target for the reduction of noise-induced cochlear damage.


Figures

Figure 1.
Figure 1.
MMP enzymatic activities in normal and noise-traumatized tissues. A, Comparison of MMP activities in tissues from the cochlea, brain, and kidney. The activities in the cochlea and kidney were higher than that in the brain (one-way ANOVA, Tukey's test, *p < 0.05). B, C, Comparisons of MMP activities between noise-exposed and control cochleae at 2 h (B) and 1 d (C) after noise exposure. The asterisk in C indicates a significant difference (Student's t test, *p < 0.05). The data are the mean ± SD RFUs per milligram of protein from five biological repetitions.
Figure 2.
Figure 2.
Comparison of the expression pattern of MMP-related genes between the apical and basal regions of the cochlear sensory epithelium. A, Scatter plot showing the correlation between the expression levels (ΔCt) of MMPs and their related genes in apical samples compared with those in basal samples (analyzed with Pearson's analysis). B, Comparison of the expression levels of MMPs and their related genes between the apical and the basal samples. Most of the examined genes exhibited higher Ct values (lower expression levels) in the basal samples (fold difference > 2 and FDR = 0, SAM analysis), except for three genes (marked with asterisks) that showed either a small Ct difference (<2, Mmp12) or lower Ct values in the basal samples (Adamts1 and Timp3). However, these differences for Adamts1 and Timp3 were relatively minor (ΔCt difference < 0.5). C, Correlation between the RNA-seq and qRT-PCR data for the genes identified with both assays (analyzed with Pearson's analysis).
Figure 3.
Figure 3.
Site-specific changes in MMPs and their related genes in the cochlear sensory epithelium examined at 2 h after noise exposure. The image lists the genes for which the expression levels were exclusively or concurrently altered in the apical and basal sections of the sensory epithelium. All of the listed genes were upregulated except for Mmp11 (marked by the asterisk), which was downregulated.
Figure 4.
Figure 4.
Dynamic changes in the expression levels of the MMP-related genes at three time points (2 h, 1 d, and 28 d) after noise exposure. To reduce the complexity of the figure, the data presented are the expression changes with FDR values < 6.19% (SAM analysis). For the expression changes with greater FDRs, the expression values are assigned to zero.
Figure 5.
Figure 5.
Expression changes in the Timp1 protein in the sensory epithelium at 2 h after noise exposure. A, B, The Timp1 immunoreactivity in a normal organ of Corti. The tissue was doubly stained with propidium iodide (red fluorescence, A) for the illustration of the nuclei and an antibody against Timp1 (green fluorescence, B). The TIMP1 immunoreactivity was present primarily in the cytoplasm (arrows). IHC, Inner hair cell; OHC1, OHC2, OHC3, first, second, and third rows of outer hair cells, respectively. D–F, Timp1 immunolabeling in a sensory epithelium collected at 2 h after the noise exposure. D shows the nuclear morphology. E shows the Timp1 immunoreactivity. F is a superimposed image of D and E. The arrows in D point to the outer hair cells that exhibited nuclear condensation. The immunoreactivity of Timp1 in these cells was decreased (arrows in E and F). G–I, Timp1 immunoreactivity in sensory cells showing advanced nuclear condensation. The arrows in G point to the outer hair cells that exhibited fragmented nuclei. TIMP1 immunoreactivity in these cells was increased (arrows in H) compared with the neighboring outer hair cells that had relatively normal nuclear morphology. The double arrow in G–I points to a cell with a fragmented nucleus but without increased Timp1 immunoreactivity. C, The average number of sensory cells that exhibited nuclear malformation and the average of number of sensory cells that exhibited increased Timp1 immunoreactivity (mean ± SD). Sample size, n indicates the number of cochleae. Scale bar: D, 20 μm.
Figure 6.
Figure 6.
Expression changes in the Timp2 protein in the cochlear sensory epithelium after acoustic trauma. A, B, Timp2 immunoreactivity in a normal sensory epithelium doubly stained with propidium iodide (red fluorescence in A) for the illustration of nuclei and an antibody against Timp2 (green fluorescence in B). C, A combined image from A and B. The Timp2 immunoreactivity was weakly present in the cytoplasm. IHC, Inner hair cell; OHC1, OHC2, OHC3, first, second, and third rows of outer hair cells, respectively. D–F, TIMP2 immunolabeling in a sensory epithelium collected at 2 h after the noise exposure. The arrows in D point to the outer hair cells with condensed nuclei. These cells exhibited a marked increase in Timp2 immunoreactivity in the circumferential ring of the outer hair cells (arrows in E and F). The double arrows point to the cells that exhibited nuclear condensation but not increased Timp2 immunoreactivity in the circumferential ring. There was no increased immunoreactivity in the circumferential rings of the sensory cells that had normal nuclear morphology. G, The average number of the sensory cells per cochlea that exhibited nuclear malformation and the average number of sensory cells that exhibited increased Timp1 immunoreactivity. H, I, Bax immunoreactivity in a noise-traumatized organ of Corti. The arrows in H point to the sensory cells with increased Bax immunoreactivity. Note that these cells also displayed nuclear condensation. Only weak Bax immunoreactivity was observed in the sensory cells with normal nuclear morphology. Scale bar: D, 20 μm.
Figure 7.
Figure 7.
Effect of the doxycycline treatment and the saline treatment on the ABR thresholds and the cochlear sensory cell viability. A, Comparison of the ABR thresholds measured before, immediately after, and 1 week after the doxycycline treatment (50 mg · kg−1 · d−1 for 7 d) across the five tested frequencies. The asterisks indicate the presence of significant differences compared with the pretreatment thresholds (two-way ANOVA, Bonferroni's post hoc test, p < 0.05–0.001). B, Comparison of the ABR thresholds tested before and after the saline treatment in the control group animals. No significant differences were present. C, Comparison of the numbers of missing sensory cells per cochlea among the normal animals (saline treated), the animals that received a dose of 50 mg · kg−1 · d−1 doxycycline treatment for 7 d, and the animals that received a dose of 100 mg · kg−1 · d−1 for 7 d. The asterisk indicates a significant difference (one-way ANOVA, Tukey's test, *p < 0.05). The error bars represent the SD. n indicates the number of cochleae.
Figure 8.
Figure 8.
The effect of the doxycycline treatment (50 mg · kg−1 · d−1 for 7 d) on the cochlear MMP enzymatic activity and the transcriptional expression levels of four MMPs. A, Comparison of the cochlear MMP activity between the doxycycline-treated and the saline-treated animals. The dots represent the activities of the individual samples (RFUs per milligram of protein). The middle lines represent the mean values. The top and bottom lines represent 1 SD. B, Comparison of the relative expression levels (ΔCt) of four MMP genes between the doxycycline-treated and the saline-treated cochleae. The differences were not statistically significant (Student's t test, p > 0.05). n indicates the number of biological repetitions.
Figure 9.
Figure 9.
The effect of doxycycline treatment on noise-induced ABR changes. A, Comparison of the ABR thresholds between the animals treated with or without doxycycline during the 7 d treatment (50 mg · kg−1 · d−1), marked by the shaded area. *p < 0.05 (two-way ANOVA, Tukey's test). B, The difference in ABR thresholds between the animals treated with or without the 7 d treatment of doxycycline is relatively homogenous across the five tested frequencies. C, Comparison of the ABR thresholds between the doxycycline-treated and the control animals measured 4 weeks after the noise exposure (3 weeks after the completion of the doxycycline treatment). There were no statistically significant differences between the thresholds across all five of the tested frequencies (two-way ANOVA, Tukey's test, p > 0.05). n indicates the number of cochleae.
Figure 10.
Figure 10.
Comparison of the ABR thresholds between the Mmp7−/− and wild-type (C57BL/6J) mice. A, No significant difference in the ABR thresholds between the Mmp7−/− and wild-type mice under the normal physiological conditions. B, The Mmp7−/− mice exhibit an average of 11.6 ± 8.6 dB greater hearing loss than the wild-type mice 7 d after noise exposure (two-way ANOVA, F = 14.0, df = 1,100, p < 0.01). n indicates the number of cochleae for each group.
Figure 11.
Figure 11.
Comparison of the ABR thresholds between the animals treated with or without doxycycline (50 mg · kg−1 · d−1 for 3 doses in 1.5 d before the noise exposure). The shaded area represents the period of the doxycycline treatment. *p < 0.05 (two-way ANOVA, Tukey's test). n indicates the number of cochleae.
Figure 12.
Figure 12.
The effect of doxycycline treatment on noise-induced sensory cell damage. A, Cochleogram showing the distribution of the missing sensory cells in the cochleae from the noise-exposed animals treated with or without doxycycline, as well as from the control animals that received neither noise nor doxycycline treatment. B, Comparison of the numbers of missing sensory cells per cochlea among the control, noise-exposed with doxycycline treatment, and noise-exposed with saline treatment animals. The asterisk indicates the presence of a significant difference (Student's t test, *p < 0.05). Error bars indicate SD. n indicates the number of cochleae.

Similar articles

Cited by

References

    1. Bedi A, Fox AJ, Kovacevic D, Deng XH, Warren RF, Rodeo SA. Doxycycline-mediated inhibition of matrix metalloproteinases improves healing after rotator cuff repair. Am J Sports Med. 2010;38:308–317. - PubMed
    1. Birkedal-Hansen H, Moore WG, Bodden MK, Windsor LJ, Birkedal-Hansen B, DeCarlo A, Engler JA. Matrix metalloproteinases: a review. Crit Rev Oral Biol Med. 1993;4:197–250. - PubMed
    1. Bohne BA, Yohman L, Gruner MM. Cochlear damage following interrupted exposure to high-frequency noise. Hear Res. 1987;29:251–264. - PubMed
    1. Bohne BA, Harding GW, Lee SC. Death pathways in noise-damaged outer hair cells. Hear Res. 2007;223:61–70. - PubMed
    1. Burggraf D, Trinkl A, Dichgans M, Hamann GF. Doxycycline inhibits MMPs via modulation of plasminogen activators in focal cerebral ischemia. Neurobiol Dis. 2007;25:506–513. - PubMed

Publication types

MeSH terms