. 2012 Nov 30;287(49):40924-37.
doi: 10.1074/jbc.M112.405837. Epub 2012 Oct 18.

The NAD+-dependent histone deacetylase SIRT6 promotes cytokine production and migration in pancreatic cancer cells by regulating Ca2+ responses

Affiliations

The NAD+-dependent histone deacetylase SIRT6 promotes cytokine production and migration in pancreatic cancer cells by regulating Ca2+ responses

Inga Bauer et al. J Biol Chem. .

Abstract

Cytokine secretion by cancer cells contributes to cancer-induced symptoms and angiogenesis. Studies show that the sirtuin SIRT6 promotes inflammation by enhancing TNF expression. Here, we aimed to determine whether SIRT6 is involved in conferring an inflammatory phenotype to cancer cells and to define the mechanisms linking SIRT6 to inflammation. We show that SIRT6 enhances the expression of pro-inflammatory cyto-/chemokines, such as IL8 and TNF, and promotes cell migration in pancreatic cancer cells by enhancing Ca(2+) responses. Via its enzymatic activity, SIRT6 increases the intracellular levels of ADP-ribose, an activator of the Ca(2+) channel TRPM2. In turn, TRPM2 and Ca(2+) are shown to be involved in SIRT6-induced TNF and IL8 expression. SIRT6 increases the nuclear levels of the Ca(2+)-dependent transcription factor, nuclear factor of activated T cells (NFAT), and cyclosporin A, a calcineurin inhibitor that reduces NFAT activity, reduces TNF and IL8 expression in SIRT6-overexpressing cells. These results implicate a role for SIRT6 in the synthesis of Ca(2+)-mobilizing second messengers, in the regulation of Ca(2+)-dependent transcription factors, and in the expression of pro-inflammatory, pro-angiogenic, and chemotactic cytokines. SIRT6 inhibition may help combat cancer-induced inflammation, angiogenesis, and metastasis.


Figures

FIGURE 1.
FIGURE 1.
SIRT6 regulates cytokine expression in pancreatic cancer cells. BxPC-3 cells were engineered by retroviral transduction to express SIRT6 WT (A) or sh2 SIRT6 (B) or the respective empty vector pBP or pRS, and protein extracts were analyzed by immunoblotting for SIRT6 levels (one representative experiment of three is shown). C, these cell lines were stimulated for 48 h with 25 ng/ml PMA and analyzed for the induction of a panel of 93 immune genes using commercially available gene expression arrays. 15 of 93 genes were identified to be differently regulated in SIRT6-expressing or -silenced cells. mRNA levels were measured by qPCR and quantified versus the GAPDH housekeeping gene. Indicated is the -fold increase/decrease versus vector cells calculated by the 2−ΔΔCt method.
FIGURE 2.
FIGURE 2.
SIRT6 overexpression leads to increased cytokine expression in pancreatic cancer cells. BxPC-3 cells were engineered by retroviral transduction to express SIRT6 WT, SIRT6 H133Y, or pBP. A, thereafter, nuclear protein extracts were analyzed by immunoblotting for SIRT6, acetyl-H3K9, and histone H3 levels (one representative experiment of three is shown). B, BxPC-3 cells were incubated for 48 h in the presence or absence of 25 ng/ml PMA. IL8 and TNF concentrations in supernatants were detected by ELISA. Data are expressed as mean ± S.D. (error bars) (n = 3). p values were calculated using one-way ANOVA for SIRT6 WT or SIRT6 H133Y versus vector control cells pBP (with or without PMA) (***, p < 0.0005; **, p < 0.005; *, p < 0.05; ns, p > 0.05) or for SIRT6 WT versus SIRT6 H133Y (with or without PMA) (###, p < 0.0005; #, p < 0.05). C, IL8 and TNF mRNA levels were measured by qPCR and quantified versus the RPLP0 housekeeping gene. Indicated is the -fold increase versus untreated pBP cells calculated by the 2−ΔΔCt method. Data are represented as mean ± S.D. (n = 3). p values were calculated using one-way ANOVA for SIRT6 WT or SIRT6 H133Y versus pBP (with or without PMA) (***, p < 0.0005; **, p < 0.005; ns, p > 0.05) or for SIRT6 WT versus SIRT6 H133Y (with or without PMA) (###, p < 0.0005).
FIGURE 3.
FIGURE 3.
SIRT6 silencing reduces cytokine expression in PDAC cells. BxPC-3 cells were engineered by retroviral transduction to express SIRT6 shRNA sh2 or the empty vector pRS. A, nuclear protein extracts were analyzed by immunoblotting for SIRT6, acetyl-H3K9, and histone H3 levels (one representative experiment of three is shown). B, BxPC-3 cells were incubated for 48 h with 25 ng/ml PMA. IL8 and TNF concentrations in supernatants were detected by ELISA. Data are expressed as mean ± S.D. (error bars) (n = 4). p values were calculated using an unpaired t test for sh2 SIRT6 versus vector control cell pRS (***, p < 0.0005). C, IL8 and TNF mRNA levels were measured by qPCR and quantified versus the RPLP0 housekeeping gene. Indicated is the -fold increase versus untreated pBP cells calculated by the 2−ΔΔCt method. Data are represented as mean ± S.D. (n = 3). p values were calculated using an unpaired t test for sh2 SIRT6 versus vector control cell pRS (***, p < 0.0005).
FIGURE 4.
FIGURE 4.
Sirt6KO mouse dendritic cells exhibit defective cytokine expression. 6 × 10⁶ WT or Sirt6KO BMDCs/well were plated in 6-well plates and stimulated with or without 1 μg/ml CpG for the indicated time period. Thereafter, cells were harvested, washed, and used for RNA isolation. Cxcl1 (A), Cxcl2 (B), Tnf (C), and Hprt1 (housekeeping) expression were determined by qPCR. One representative experiment of three is presented. Error bars, S.D.
FIGURE 5.
FIGURE 5.
SIRT1 reduces TNF expression in PDAC cells. A and B, BxPC-3 cells were engineered by retroviral transduction to express SIRT1 WT, SIRT1 H363Y, or pBP. Cells were stimulated with or without 25 ng/ml PMA for 48 h and subsequently used for RNA extraction. SIRT1 (A) and TNF levels (B) were determined by qPCR. C and D, BxPC-3 cells were transfected with or without (CTR) SIRT1-specific siRNAs (siSIRT1) or with scrambled siRNAs (siSCR) as a control. Thereafter, cells were stimulated with or without PMA for 48 h and subsequently used for RNA extraction. SIRT1 (C) and TNF levels (D) were determined by qPCR. p values were calculated by unpaired t test versus control cells (A and B, pBP; C, CTR; D, siSCR) (***, p < 0.0005; **, p < 0.005; *, p < 0.05; ns, p > 0.05) or versus SIRT1 H363Y for SIRT1 WT cells (B) (##, p < 0.005; #, p < 0.05). Error bars, S.D.
FIGURE 6.
FIGURE 6.
NAD+ depletion and sirtuin inhibition reduce cytokine expression in PDAC cells. A, BxPC-3 cells were treated for 48 h with or without 100 nm FK866 in the presence or absence of 1 mm nicotinic acid (Na). Cells were harvested and lysed in 0.6 m perchloric acid, and NAD+ content was measured in neutralized extracts. NAD+ values were normalized to protein content. Data are expressed as mean ± S.D. (error bars) (n = 3). p values were calculated versus untreated control cells (NT) using one-way ANOVA (***, p < 0.0005; ns, p > 0.05). B, BxPC-3 cells were preincubated for 24 h with 100 nm FK866 with or without 1 mm nicotinic acid, and then 50 μm sirtinol and 25 ng/ml PMA were added where indicated and incubated for a further 48 h. IL8 and TNF concentrations in supernatants were detected by ELISA. Data are expressed as mean ± S.D. (n = 4). p values were calculated versus PMA-treated control cells using one-way ANOVA (***, p < 0.0005; **, p < 0.005; ns, p > 0.05). C, IL8 and TNF mRNA levels were measured by qPCR and quantified versus the RPLP0 housekeeping gene. Indicated is the -fold increase versus untreated cells calculated by the 2−ΔΔCt method. Data are represented as mean ± S.D. (n = 3). p values were calculated versus PMA-treated cells using one-way ANOVA (***, p < 0.0005; ns, p > 0.05).
FIGURE 7.
FIGURE 7.
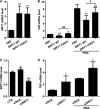
SIRT6 regulates Ca2+ responses and cell migration in PDAC cells. A, serum-starved BxPC-3 cells were preincubated for 30 min with 50 μm EGTA-AM, and then cells were washed twice with PBS and treated for 1 h with 25 ng/ml PMA in HBSS; alternatively, cells were incubated in the presence or absence of 25 ng/ml PMA in Ca2+-free HBSS with 0.2 mm EDTA. Data are expressed as mean ± S.D. (n = 3). p values were calculated versus untreated control cells (NT) using one-way ANOVA (***, p < 0.0005). B and C, pBP, SIRT6 WT, SIRT6 H133Y, pRS, and sh2 SIRT6 BxPC-3 cells were seeded on glass bottom cell culture dishes and incubated for 48 h in the presence or absence of 25 ng/ml PMA. Cells were then loaded with Fura-2AM, and [Ca2+]i measurements and calibrations were performed with a microfluorimetric system. Data are shown as mean ± S.D. (error bars) (n = 3). p values were calculated using one-way ANOVA (B) or unpaired t test (C) versus corresponding untreated cells (NT) (***, p < 0.0005; **, p < 0.005; *, p < 0.05; ns, p > 0.05) or for PMA-treated SIRT6 WT versus pBP or versus SIRT6 H133Y (###, p < 0.0005). D and E, pBP, SIRT6 WT, SIRT6 H133Y, pRS, and sh2 SIRT6 BxPC-3 cells were resuspended in chemotaxis buffer, and chemotaxis assays were performed with PMA (100 ng/ml) or IL8 (10 ng/ml) as chemoattractants as described under “Experimental Procedures.” Transmigrated cells were collected and quantified by a fluorimetric assay, and the chemotaxis index (CI) was determined. Data are expressed as mean ± S.D. (n = 3). p values were calculated using one-way ANOVA (D) or unpaired t test (E) versus vector control cells (D, pBP; E, pRS) (**, p < 0.005; *, p < 0.05; ns, p > 0.05) or for SIRT6 WT versus SIRT6 H133Y cells (##, p < 0.005; #, p < 0.05).
FIGURE 8.
FIGURE 8.
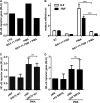
SIRT6 regulates intracellular levels of ADPr, an activator of TRPM2. A and B, pBP, SIRT6 WT, SIRT6 H133Y, pRS, and sh2 SIRT6 BxPC-3 cell extracts were supplemented with [14C]ADPr and then injected into a first HPLC analysis. Fractions were collected, and the radioactive fraction was dried, resuspended in water, and subjected to an analytical phosphate HPLC analysis. Data are expressed as mean ± S.D. (error bars) (n = 3). p values were calculated using one-way ANOVA (A) or unpaired t test (B) versus vector control cells (A, pBP; B, pRS) (**, p < 0.005; *, p < 0.05; ns, p > 0.05) or for SIRT6 WT versus SIRT6 H133Y cells (#, p < 0.05). C, SIRT6 WT BxPC-3 cells were transfected with siRNAs targeting human TRPM2. 48 h post-transfection, the TRPM2 mRNA expression level was detected in qPCR and quantified versus the GAPDH housekeeping gene. Data are shown as mean ± S.D. (n = 3). p values were calculated versus control cells transfected with scrambled siRNAs (siSCR) using unpaired t test. ***, p < 0.0005. D, SIRT6 WT BxPC-3 transfected with siTRPM2 were starved overnight and then treated with or without 25 ng/ml PMA for 1 h. IL8 and TNF mRNA levels were measured by qPCR and quantified versus the GAPDH housekeeping gene. Indicated is the -fold increase versus untreated cells calculated by the 2−ΔΔCt method. Data are represented as mean ± S.D. (n = 3). p values were calculated versus control cells transfected with scrambled siRNAs (siSCR) using an unpaired t test (***, p < 0.0005).
FIGURE 9.
FIGURE 9.
The calcineurin-NFAT pathway promotes TNF and IL8 induction downstream of SIRT6. A, pBP, SIRT6 WT, pRS, and sh2 SIRT6 BxPC-3 cells were incubated with 25 ng/ml PMA for 45 min. Nuclear extracts were analyzed with a cAMP/Ca2+ protein/DNA array. A semiquantitative analysis of the positive spots detected on the membranes was performed. Results are expressed as mean ± S.D. of three separate experiments and indicate the protein level in SIRT6 WT cells (white bars) or in sh2 SIRT6 cells (black bars), relative to the respective vector cells. B, SIRT6-overexpressing BxPC-3 cells were incubated with or without 1 μm cyclosporin A (CyA) for 1 h. Thereafter, cells were stimulated with 25 ng/ml PMA. 48 h later, cells were used for RNA isolation, and TNF and IL8 levels were detected by qPCR. C and D, SIRT6-overexpressing BxPC-3 cells were transfected with or without scrambled siRNAs or with anti-GATA4 siRNAs. 24 h later, cells were used for RNA isolation, and GATA4 mRNA was quantified by qPCR (C). Alternatively, cells were stimulated with PMA for an additional 48 h before RNA was isolated, and TNF and IL8 levels were determined by qPCR (D). Data are shown as mean ± S.D. (error bars) (n = 3). p values were calculated versus unstimulated control cells (B, CTR; C and D, siSCR) using an unpaired t test (***, p < 0.0005; *, p < 0.05; ns, p > 0.05).
FIGURE 10.
FIGURE 10.
SIRT6 does not affect NF-κB transcriptional activity in BxPC-3 cells. A, NF-κB-dependent transcription was measured with an NF-κB reporter gene system in BxPC-3 cells stimulated or not with 25 ng/ml PMA for 15 h. Before PMA addition, cells were preincubated for 1 h with or without 20 μm BAY 11-7082. One representative experiment of two is shown. B, BxPC-3 cells were preincubated for 1 h with or without 20 μm BAY 11-7082. Subsequently, cells were stimulated with or without 25 ng/ml PMA for 2 h. Thereafter, cells were used for RNA extraction, and IL8 and TNF mRNA levels were quantified by qPCR. Data are expressed as mean ± S.D. (error bars) (n = 3). p values were calculated using an unpaired t test (***, p < 0.0005). C and D, NF-κB-dependent transcription was measured with an NF-κB reporter gene system in pBP, SIRT6 WT (C), pRS, and sh2 SIRT6 (D) BxPC-3 cells stimulated or not with 25 ng/ml PMA for 15 h. Data are expressed as mean ± S.D. (n = 3). p values were calculated using an unpaired t test (ns, p > 0.05). RLU, relative luciferase units.
FIGURE 11.
FIGURE 11.
SIRT6 and SIRT1 expression in primary PDACs and SIRT6 expression in PDAC cell lines. A and B, SIRT6 and SIRT1 expression in pancreatic cancers (pc) and in healthy pancreatic tissue (n) was determined using three independent, well annotated gene expression microarray data sets. Available data were transformed into Z-scores (see “Experimental Procedures”). C, total RNA was isolated from PDAC cell lines and HPNE cells and used to detect SIRT6 expression by qPCR. Results were normalized to SIRT6 expression in HPNE cells. Data are shown as mean ± S.D. (error bars) (n = 3) (***, p < 0.0005; **, p < 0.005; *, p < 0.05; ns, p > 0.05).
FIGURE 12.
FIGURE 12.
Putative mechanism for SIRT6-induced, TRPM2-mediated IL8 and TNF release and migration in pancreatic cancer cells. SIRT6 catalyzes the NAD+-dependent deacetylation of target histones, thereby generating nicotinamide (NAM) and OAADPr, which can be subsequently hydrolyzed to ADPr that in turn activates the Ca2+ channel TRPM2. Ca2+ enters the cell, induces the expression of IL8 and TNF via NFAT signaling, and enhances cell migration.

Similar articles

Cited by

References

    1. Coussens L. M., Werb Z. (2002) Inflammation and cancer. Nature 420, 860–867 - PMC - PubMed
    1. Hanahan D., Weinberg R. A. (2011) Hallmarks of cancer. The next generation. Cell 144, 646–674 - PubMed
    1. Balkwill F. R., Mantovani A. (2012) Cancer-related inflammation. Common themes and therapeutic opportunities. Semin. Cancer Biol. 22, 33–40 - PubMed
    1. Fernando R. I., Castillo M. D., Litzinger M., Hamilton D. H., Palena C. (2011) IL-8 signaling plays a critical role in the epithelial-mesenchymal transition of human carcinoma cells. Cancer Res. 71, 5296–5306 - PMC - PubMed
    1. Mantovani A. (2010) Molecular pathways linking inflammation and cancer. Curr. Mol. Med. 10, 369–373 - PubMed

Publication types

MeSH terms