. 2012;7(10):e46952.
doi: 10.1371/journal.pone.0046952. Epub 2012 Oct 15.

The peptide specificity of the endogenous T follicular helper cell repertoire generated after protein immunization

Affiliations

The peptide specificity of the endogenous T follicular helper cell repertoire generated after protein immunization

Scott A Leddon et al. PLoS One. 2012.

Abstract

T follicular helper (Tfh) cells potentiate high-affinity, class-switched antibody responses, the predominant correlate of protection from vaccines. Despite intense interest in understanding both the generation and effector functions of this lineage, little is known about the epitope specificity of Tfh cells generated during polyclonal responses. To date, studies of peptide-specific Tfh cells have relied on either the transfer of TcR transgenic cells or use of peptide:MHC class II tetramers and antibodies to stain TcR and follow limited peptide specificities. In order to comprehensively evaluate polyclonal responses generated from the natural endogenous TcR repertoire, we developed a sorting strategy to separate Tfh cells from non-Tfh cells and found that their epitope-specific responses could be tracked with cytokine-specific ELISPOT assays. The immunodominance hierarchies of Tfh and non-Tfh cells generated in response to immunization with several unrelated protein antigens were remarkably similar. Additionally, increasing the kinetic stability of peptide-MHC class II complexes enhanced the priming of both Tfh and conventional CD4 T cells. These findings may provide us with a strategy to rationally and selectively modulate epitope-specific Tfh responses. By understanding the parameters that control epitope-specific priming, vaccines may be tailored to enhance or focus Tfh responses to facilitate optimal B cell responses.


Conflict of interest statement

Competing Interests: The authors have declared that no competing interests exist.

Figures

Figure 1
Figure 1. The conical phenotypic markers of Tfh cells established in other mouse strains are maintained in BALB/c mice.
Animals were immunized subcutaneously in the pinna of the ear with MalE protein emulsified in IFA. Nine days later, CD4+ cells from draining cervical lymph nodes were analyzed for Tfh cell phenotypic markers. (A) CD4+CXCR5highBCL6+ cells were analyzed for dual expression of PD1 and ICOS. (B) CD44 staining of CD4+ (filled) and CD4+CXCR5highBCL6+ (open) cells. (C) Gating strategy gating of Tfh, non-Tfh, and CD4+CD44low cell populations represented in D and E. (D) Expression of ICOS, CD69, BCL6, CD62L, and CCR7 are shown for Tfh (thick line), non-Tfh (shaded), and CD4+CD44low (thin line) populations. (E) Absolute numbers of Tfh (open squares) and non-Tfh (closed squares) cells within the lymph nodes were calculated by multiplying the percent of each cell type by the total number of cells from the harvested lymph nodes. Error bars show the standard error of the mean (S.E.M) of three to five single mouse experiments per time point.
Figure 2
Figure 2. Schematic of sorting strategy used to separate Tfh from non-Tfh cells.
CD4+ T cells are first enriched from draining lymph node cells with untouched paramagnetic bead separation. The CD4+ T cell enriched population is then stained for CD4, CD44, CXCR5, and PD1 and cytometry is used to sort stained cells by first gating on the CD4+CD44high population and then separating Tfh from non-Tfh cells. Values displayed on plots are the percent of the population within each gate and are indicative of a representative experiment.
Figure 3
Figure 3. Sorted CD4+CD44highCXCR5highPD1high cells express a transcriptional profile that is consistent with the Tfh phenotype.
Real-time PCR analyses of cDNA synthesized from total RNA extracted from sorted Tfh and non-Tfh cells (as depicted in Fig. 2) and analyzed for expression of mRNA encoding transcription factors (A), chemokine receptors or accessory molecules (B), or cytokines (C). Expression data is normalized to the average expression of Bact, Gapdh, B2m. The means of four experiments are shown, with error bars indicating the standard error of the mean (S.E.M). Data were analyzed with unpaired two-tailed student T-test, and * indicates a p-value of less than 0.1, while ** indicates a p-value of less than 0.001.
Figure 4
Figure 4. Peptide-specific Tfh responses can be measured with ELISPOT assays.
On day 8 or 9 days post-immunization with MalE containing the HA-derived S1 epitope (A), HEL (B), or OVA (C), Tfh and non-Tfh cells were separated and peptide-specific responses were measured with IL-21, IL-4, IL-2 and IFNγ ELISPOT assays. The frequency of peptide-specific cytokine-secreting Tfh and non-Tfh cells are shown as cytokine-specific spots per 1,000,000 cells. Open and shaded bars show Tfh and non-Tfh cells respectively. The means of two experiments are shown, with error bars indicating the range.
Figure 5
Figure 5. The frequency of cytokine secreting cells and the immunodominance hierarchies are not affected by the depletion of Tregs prior to ELISPOT assays.
CD4 T cells were enriched from the cLNs on day nine after ear immunization with MalE-S1 protein. An aliquot of CD4 T cells was depleted of Tregs with CD25 microbeads prior to cytokine-specific ELISpot assays. Treg depletion (closed bars) did not increase the frequency of cytokine production (A) or alter the immunodominance hierarchies (B). Data are represented as the mean of two experiments with error bars depicting the range between experiments.
Figure 6
Figure 6. The peptide-specific hierarchies of the Tfh and non-Tfh population are remarkably similar, Independent of the cytokine assayed.
The peptide specificities of Tfh and non-Tfh cells were evaluated with IL-2, IL-21, IL-4, and IFNγ ELISPOT assays on day 8 or 9 post-immunization. The percent of the total response for each peptide tested (peptide-specific/sum of all peptide responses measured) generated after immunization with MalE encoding the S1 epitope (A), HEL (B), or OVA (C) are shown for both Tfh (open bars) and non-Tfh (shaded bars). Data are presented as the mean of two experiments with error bars representing the range.
Figure 7
Figure 7. Immunodominance hierarchies established within the draining lymph node are maintained at secondary lymph tissues and at the site of immunization.
The number of Tfh cells, as defined by CD4+CD44highCXCR5highPD1high cells, enumerated from the cLN, iLN, spleen, or the ear are shown from unimmunized mice or mice immunized 2, 9, 15, or 26 days prior with MalE-S1 protein. The fraction of Tfh cells present at each site is shown, with the standard error of the mean (S.E.M) from four mice per time point (A). CD4 T cells were enriched from cervical and inguinal lymph nodes, as well as from spleen and the pinna of the ear 15 days after immunization of mice with MalE-S1 protein. The frequency of peptide-specific CD4 T cells was measured with ELISPOT assays and is shown in B while the percent of the total measured response is depicted in C. Frequencies are not given for ear samples due to very low responses (∼200 spots per ear). Responses from cells isolated from ear pinna were measured for IL-4 and IFNγ, while CD4 T cells from iLN were evaluated IL-2 and IFNγ production. Data represents the mean of two experiments with error bars represent the range.
Figure 8
Figure 8. The immunodominance hierarchies established within the Tfh and non-Tfh populations during the peak of the immune response are maintained late in the immune response.
As previously described, peptide-specific Tfh and non-Tfh cells responses were measured with IL-21 ELISPOT assays on day 9, 15 and 26 after MalE-LACK(I>A) protein immunization (A). On day 26 after protein immunization, peptide-specific Tfh and non-Tfh responses were measured with IL-21, IL-4, IL-2, and IFNγ ELISPOT assays. The percent of peptide responses are shown in B. Data shown represent a single experiment from cells pooled from 40–80 mice per time point.
Figure 9
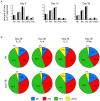
Figure 9. The kinetic stability of peptide∶MHC class II complexes determines the immunodominance of both Tfh and non-Tfh responses.
Mice were immunized with MalE protein expressing either a high or low kinetic stability peptide variant. The persistence of peptide variants with MHC class II molecules are shown in Table 2. Two pairs (LACK and HA) of kinetic stability variants were evaluated and 20–25 mice were used per group. LACK responses are shown in the top row (A, B, and C) and HA responses are shown in the bottom row (D, E, and F). The left column (A and D) shows the percent of the IL-21 secreting Tfh (open bars) or non-Tfh (shaded bars) recalled after immunizing mice with the MalE protein bearing the low stability variant (LACK(WT) or HA(T>V)), while the center column (B and E) shows the percent of response recalled after immunizing mice with the MalE protein bearing the high stability variant (LACK(I>A) or HA(T>G)). The right column (C and F) depicts the fractional response of peptide variant (white) and sum of endogenous MalE peptides (gray) of either the Tfh or non-Tfh response. Data are shown as the mean of two experiments with error bars representing the range.

Similar articles

Cited by

References

    1. Siegrist C (2008) Vaccine Immunology. In: Plotkin S, editor. Vaccines: Expert Consult. 5 ed. Philadelphia: Saunders Elsevier. pp. 17–36.
    1. Plotkin SA (2010) Correlates of protection induced by vaccination. Clin Vaccine Immunol 17: 1055–1065. - PMC - PubMed
    1. Sette A, Moutaftsi M, Moyron-Quiroz J, McCausland MM, Davies DH, et al. (2008) Selective CD4+ T cell help for antibody responses to a large viral pathogen: deterministic linkage of specificities. Immunity 28: 847–858. - PMC - PubMed
    1. Arnold CN, Campbell DJ, Lipp M, Butcher EC (2007) The germinal center response is impaired in the absence of T cell-expressed CXCR5. Eur J Immunol 37: 100–109. - PubMed
    1. Rolf J, Bell SE, Kovesdi D, Janas ML, Soond DR, et al. (2010) Phosphoinositide 3-kinase activity in T cells regulates the magnitude of the germinal center reaction. J Immunol 185: 4042–4052. - PubMed

Publication types